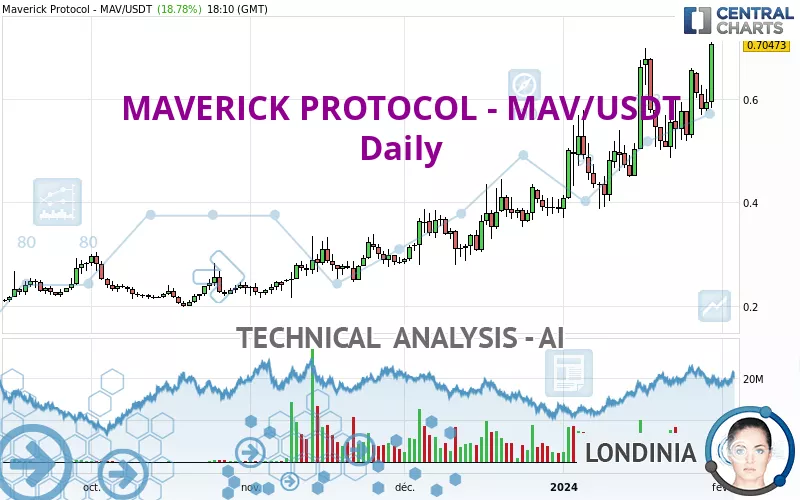
MAVERICK PROTOCOL - MAV/USDT - Daily - Technical analysis published on 01/30/2024 (GMT)
- 264
- 0
- Timeframe : Daily
- - Analysis generated on
- Status : WITHOUT TARGET

Summary of the analysis

Additional analysis
Quotes
The MAVERICK PROTOCOL - MAV/USDT rating is 0.704730 USDT. The price registered an increase of +18.78% on the session and was traded between 0.581805 USDT and 0.709407 USDT over the period. The price is currently at +21.13% from its lowest and -0.66% from its highest.A study of price movements over other periods shows the following variations:
New HIGH record (5 years)
Type : Bullish
Timeframe : Weekly
New HIGH record (1 year)
Type : Bullish
Timeframe : Weekly
New HIGH record (1st january)
Type : Bullish
Timeframe : Weekly
New HIGH record (1 month)
Type : Bullish
Timeframe : Weekly
The Central Volumes scanner detects abnormal volumes on the asset:
Abnormal volumes
Timeframe : 20 days
Abnormal volumes
Timeframe : 50 days
Technical
A technical analysis in Daily of this MAVERICK PROTOCOL - MAV/USDT chart shows a strongly bullish trend. 92.86% of the signals given by moving averages are bullish. The overall trend is supported by the strong bullish signals from short-term moving averages. The Central Indicators scanner does not detect any result on moving averages that would impact this trend.
An assessment of technical indicators shows a strong bullish signal.
Caution: the Central Indicators scanner currently detects an excess:
CCI indicator is overbought : over 100
Type : Neutral
Timeframe : Daily
Williams %R indicator is overbought : over -20
Type : Neutral
Timeframe : Daily
Pivot points : price is over resistance 1
Type : Neutral
Timeframe : Weekly
Pivot points : price is over resistance 3
Type : Neutral
Timeframe : Daily
MACD crosses UP its Moving Average
Type : Bullish
Timeframe : Daily
Momentum indicator is back over 0
Type : Bullish
Timeframe : Daily
The analysis of the price chart with Central Patterns scanners does not return any result.
The Central Candlesticks scanner which studies Japanese candlesticks did not detect anything.
| S3 | S2 | S1 | Price | |
|---|---|---|---|---|
| ProTrendLines | 0.412244 | 0.507502 | 0.676909 | 0.704730 |
| Change (%) | -41.50% | -27.99% | -3.95% | - |
| Change | -0.292486 | -0.197228 | -0.027821 | - |
| Level | Minor | Major | Intermediate | - |
Attention could also be paid to pivot points to set price objectives:
| Pivot points | S3 | S2 | S1 | PP | R1 | R2 | R3 |
|---|---|---|---|---|---|---|---|
| Standard | 0.531913 | 0.553973 | 0.573641 | 0.595701 | 0.615369 | 0.637429 | 0.657097 |
| Camarilla | 0.581834 | 0.585659 | 0.589484 | 0.593309 | 0.597134 | 0.600959 | 0.604784 |
| Woodie | 0.530717 | 0.553375 | 0.572445 | 0.595103 | 0.614173 | 0.636831 | 0.655901 |
| Fibonacci | 0.553973 | 0.569913 | 0.579761 | 0.595701 | 0.611641 | 0.621489 | 0.637429 |
| Pivot points | S3 | S2 | S1 | PP | R1 | R2 | R3 |
|---|---|---|---|---|---|---|---|
| Standard | 0.336457 | 0.410983 | 0.510637 | 0.585163 | 0.684817 | 0.759343 | 0.858997 |
| Camarilla | 0.562393 | 0.578359 | 0.594326 | 0.610292 | 0.626259 | 0.642225 | 0.658192 |
| Woodie | 0.349022 | 0.417265 | 0.523202 | 0.591445 | 0.697382 | 0.765625 | 0.871562 |
| Fibonacci | 0.410983 | 0.477519 | 0.518626 | 0.585163 | 0.651699 | 0.692806 | 0.759343 |
| Pivot points | S3 | S2 | S1 | PP | R1 | R2 | R3 |
|---|---|---|---|---|---|---|---|
| Standard | 0.143220 | 0.215214 | 0.301408 | 0.373402 | 0.459596 | 0.531590 | 0.617784 |
| Camarilla | 0.344099 | 0.358600 | 0.373100 | 0.387601 | 0.402102 | 0.416602 | 0.431103 |
| Woodie | 0.150319 | 0.218764 | 0.308507 | 0.376952 | 0.466695 | 0.535140 | 0.624883 |
| Fibonacci | 0.215214 | 0.275642 | 0.312975 | 0.373402 | 0.433830 | 0.471163 | 0.531590 |
Numerical data
The following is the status of technical indicators and moving averages registered at the time this technical analysis was created:
| RSI (14): | 64.00 | |
| MACD (12,26,9): | 0.0466 | |
| Directional Movement: | 17.458247 | |
| AROON (14): | 57.142857 | |
| DEMA (21): | 0.624000 | |
| Parabolic SAR (0,02-0,02-0,2): | 0.518925 | |
| Elder Ray (13): | 0.057381 | |
| Super Trend (3,10): | 0.448166 | |
| Zig ZAG (10): | 0.703662 | |
| VORTEX (21): | 1.1153 | |
| Stochastique (14,3,5): | 67.31 | |
| TEMA (21): | 0.635322 | |
| Williams %R (14): | -0.75 | |
| Chande Momentum Oscillator (20): | 0.128242 | |
| Repulse (5,40,3): | 21.1996 | |
| ROCnROLL: | 1 | |
| TRIX (15,9): | 1.2375 | |
| Courbe Coppock: | 31.08 |
| MA7: | 0.607631 | |
| MA20: | 0.562448 | |
| MA50: | 0.466882 | |
| MA100: | 0.373402 | |
| MAexp7: | 0.615651 | |
| MAexp20: | 0.563284 | |
| MAexp50: | 0.485333 | |
| MAexp100: | 0.402711 | |
| Price / MA7: | +15.98% | |
| Price / MA20: | +25.30% | |
| Price / MA50: | +50.94% | |
| Price / MA100: | +88.73% | |
| Price / MAexp7: | +14.47% | |
| Price / MAexp20: | +25.11% | |
| Price / MAexp50: | +45.21% | |
| Price / MAexp100: | +75.00% |
About author

Online


Add a comment
Comments
0 comments on the analysis MAVERICK PROTOCOL - MAV/USDT - Daily