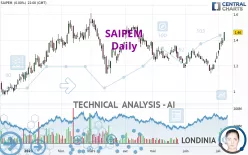
SAIPEM - Daily - Technical analysis published on 07/10/2023 (GMT)
- 298
- 0
Click here for a new analysis!
- Timeframe : Daily
- - Analysis generated on
- Status : LEVEL MAINTAINED

Summary of the analysis

Additional analysis
Quotes
The SAIPEM price is 1.4750 EUR. The price registered an increase of +1.03% on the session and was traded between 1.4425 EUR and 1.4750 EUR over the period. The price is currently at +2.25% from its lowest and 0% from its highest.Here is a more detailed summary of the historical variations registered by SAIPEM:
New HIGH record (1 month)
Type : Bullish
Timeframe : Weekly
Technical
A technical analysis in Daily of this SAIPEM chart shows a strongly bullish trend. 85.71% of the signals given by moving averages are bullish. This strongly bullish trend is supported by the strong bullish signals given by short-term moving averages. The Central Indicators market scanner is currently detecting several bullish signals that could impact this trend:
Bullish trend reversal : Moving Average 100
Type : Bullish
Timeframe : Daily
Moving Average bullish crossovers : MA20 & MA50
Type : Bullish
Timeframe : Daily
Moving Average bullish crossovers : AMA20 & AMA50
Type : Bullish
Timeframe : Daily
In fact, 17 technical indicators on 18 studied are currently bullish. Caution: the Central Indicators scanner currently detects an excess:
RSI indicator is overbought : over 70
Type : Neutral
Timeframe : Daily
CCI indicator is overbought : over 100
Type : Neutral
Timeframe : Daily
Previous candle closed over Bollinger bands
Type : Neutral
Timeframe : Daily
Williams %R indicator is overbought : over -20
Type : Neutral
Timeframe : Daily
An analysis of the price chart with the Central Patterns scanner (detector of chart patterns and resistances and supports) shows a result that can have an impact on the price change:
Near resistance of channel
Type : Bearish
Timeframe : Daily
No result was found by the Central Candlesticks scanner on Japanese candlesticks.
| S3 | S2 | S1 | Price | R1 | R2 | R3 | |
|---|---|---|---|---|---|---|---|
| ProTrendLines | 1.1625 | 1.3160 | 1.4050 | 1.4750 | 1.5306 | 3.4267 | 7.2235 |
| Change (%) | -21.19% | -10.78% | -4.75% | - | +3.77% | +132.32% | +389.73% |
| Change | -0.3125 | -0.1590 | -0.0700 | - | +0.0556 | +1.9517 | +5.7485 |
| Level | Intermediate | Major | Minor | - | Intermediate | Minor | Intermediate |
Attention could also be paid to pivot points to set price objectives:
| Pivot points | S3 | S2 | S1 | PP | R1 | R2 | R3 |
|---|---|---|---|---|---|---|---|
| Standard | 1.3518 | 1.3737 | 1.4168 | 1.4387 | 1.4818 | 1.5037 | 1.5468 |
| Camarilla | 1.4421 | 1.4481 | 1.4540 | 1.4600 | 1.4660 | 1.4719 | 1.4779 |
| Woodie | 1.3625 | 1.3790 | 1.4275 | 1.4440 | 1.4925 | 1.5090 | 1.5575 |
| Fibonacci | 1.3737 | 1.3985 | 1.4138 | 1.4387 | 1.4635 | 1.4788 | 1.5037 |
| Pivot points | S3 | S2 | S1 | PP | R1 | R2 | R3 |
|---|---|---|---|---|---|---|---|
| Standard | 1.1543 | 1.2157 | 1.3378 | 1.3992 | 1.5213 | 1.5827 | 1.7048 |
| Camarilla | 1.4095 | 1.4264 | 1.4432 | 1.4600 | 1.4768 | 1.4936 | 1.5105 |
| Woodie | 1.1848 | 1.2309 | 1.3683 | 1.4144 | 1.5518 | 1.5979 | 1.7353 |
| Fibonacci | 1.2157 | 1.2858 | 1.3291 | 1.3992 | 1.4693 | 1.5126 | 1.5827 |
| Pivot points | S3 | S2 | S1 | PP | R1 | R2 | R3 |
|---|---|---|---|---|---|---|---|
| Standard | 0.9717 | 1.0563 | 1.1657 | 1.2503 | 1.3597 | 1.4443 | 1.5537 |
| Camarilla | 1.2217 | 1.2394 | 1.2572 | 1.2750 | 1.2928 | 1.3106 | 1.3284 |
| Woodie | 0.9840 | 1.0625 | 1.1780 | 1.2565 | 1.3720 | 1.4505 | 1.5660 |
| Fibonacci | 1.0563 | 1.1304 | 1.1762 | 1.2503 | 1.3244 | 1.3702 | 1.4443 |
Numerical data
The following are the details of the technical indicators and moving averages that were collected to generate this technical analysis:
| RSI (14): | 72.83 | |
| MACD (12,26,9): | 0.0409 | |
| Directional Movement: | 25.6165 | |
| AROON (14): | 71.4286 | |
| DEMA (21): | 1.3546 | |
| Parabolic SAR (0,02-0,02-0,2): | 1.2295 | |
| Elder Ray (13): | 0.1169 | |
| Super Trend (3,10): | 1.3131 | |
| Zig ZAG (10): | 1.4675 | |
| VORTEX (21): | 1.1187 | |
| Stochastique (14,3,5): | 96.42 | |
| TEMA (21): | 1.4035 | |
| Williams %R (14): | -2.41 | |
| Chande Momentum Oscillator (20): | 0.2485 | |
| Repulse (5,40,3): | 7.3377 | |
| ROCnROLL: | 1 | |
| TRIX (15,9): | 0.1042 | |
| Courbe Coppock: | 22.97 |
| MA7: | 1.3827 | |
| MA20: | 1.2813 | |
| MA50: | 1.2784 | |
| MA100: | 1.3336 | |
| MAexp7: | 1.3889 | |
| MAexp20: | 1.3154 | |
| MAexp50: | 1.2993 | |
| MAexp100: | 1.2848 | |
| Price / MA7: | +6.68% | |
| Price / MA20: | +15.12% | |
| Price / MA50: | +15.38% | |
| Price / MA100: | +10.60% | |
| Price / MAexp7: | +6.20% | |
| Price / MAexp20: | +12.13% | |
| Price / MAexp50: | +13.52% | |
| Price / MAexp100: | +14.80% |
News
The last news published on SAIPEM at the time of the generation of this analysis was as follows:
About author
Online


Add a comment
Comments
0 comments on the analysis SAIPEM - Daily