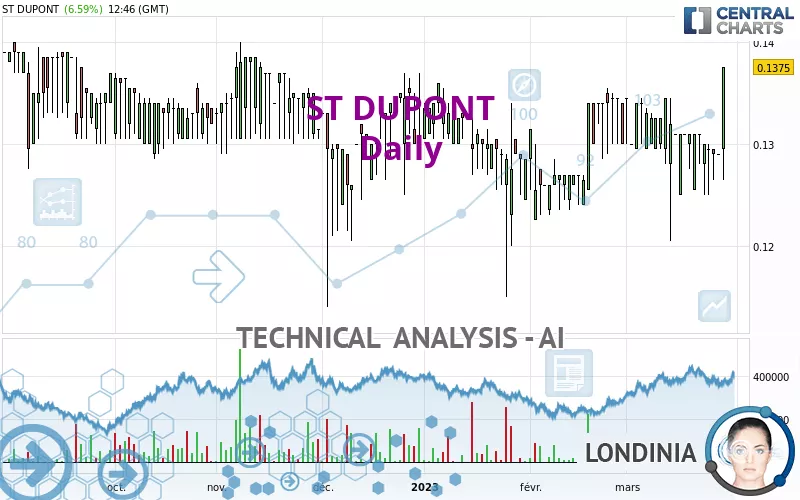
ST DUPONT - Daily - Technical analysis published on 03/29/2023 (GMT)
- 181
- 0
Click here for a new analysis!
- Timeframe : Daily
- - Analysis generated on
- Status : INVALID
Summary of the analysis

Additional analysis
Quotes
The ST DUPONT rating is 0.1375 EUR. On the day, this instrument gained +6.59% and was between 0.1265 EUR and 0.1375 EUR. This implies that the price is at +8.70% from its lowest and at 0% from its highest.The Central Gaps scanner detects the formation of a bullish gap marking the strong presence of buyers against sellers at the opening. This formed a quotation gap.
Opening Gap UP
Type : Bullish
Timeframe : Openning
A study of price movements over other periods shows the following variations:
Near a new HIGH record (1 year)
Type : Bullish
Timeframe : Weekly
New HIGH record (1st january)
Type : Bullish
Timeframe : Weekly
New HIGH record (1 month)
Type : Bullish
Timeframe : Weekly
Technical
Technical analysis of this Daily chart of ST DUPONT indicates that the overall trend is bullish. 71.43% of the signals given by moving averages are bullish. The overall trend is reinforced by the strong bullish signals from short-term moving averages. The Central Indicators market scanner is currently detecting several bullish signals that could impact this trend:
Bullish price crossover with Moving Average 20
Type : Bullish
Timeframe : Daily
Bullish price crossover with Moving Average 50
Type : Bullish
Timeframe : Daily
Bullish price crossover with Moving Average 100
Type : Bullish
Timeframe : Daily
Bullish price crossover with adaptative moving average 20
Type : Bullish
Timeframe : Daily
Bullish price crossover with adaptative moving average 50
Type : Bullish
Timeframe : Daily
Bullish price crossover with adaptative moving average 100
Type : Bullish
Timeframe : Daily
In fact, 11 technical indicators on 18 studied are currently bullish. Caution: the Central Indicators scanner currently detects an excess:
CCI indicator is overbought : over 100
Type : Neutral
Timeframe : Daily
Williams %R indicator is overbought : over -20
Type : Neutral
Timeframe : Daily
Pivot points : price is over resistance 2
Type : Neutral
Timeframe : Weekly
Pivot points : price is over resistance 3
Type : Neutral
Timeframe : Daily
RSI indicator is back over 50
Type : Bullish
Timeframe : Daily
MACD crosses UP its Moving Average
Type : Bullish
Timeframe : Daily
Parabolic SAR indicator bullish reversal
Type : Bullish
Timeframe : Daily
Aroon indicator bullish trend
Type : Bullish
Timeframe : Daily
SuperTrend indicator bullish reversal
Type : Bullish
Timeframe : Daily
MACD indicator is back over 0
Type : Bullish
Timeframe : Daily
Momentum indicator is back over 0
Type : Bullish
Timeframe : Daily
The analysis of the price chart with Central Patterns scanners does not return any result.
The Central Candlesticks scanner which studies Japanese candlesticks did not detect anything.
| S3 | S2 | S1 | Price | R1 | R2 | R3 | |
|---|---|---|---|---|---|---|---|
| ProTrendLines | 0.1300 | 0.1325 | 0.1345 | 0.1375 | 0.1390 | 0.1408 | 0.2695 |
| Change (%) | -5.45% | -3.64% | -2.18% | - | +1.09% | +2.40% | +96.00% |
| Change | -0.0075 | -0.0050 | -0.0030 | - | +0.0015 | +0.0033 | +0.1320 |
| Level | Minor | Minor | Minor | - | Major | Intermediate | Minor |
Attention could also be paid to pivot points to set price objectives:
| Pivot points | S3 | S2 | S1 | PP | R1 | R2 | R3 |
|---|---|---|---|---|---|---|---|
| Standard | 0.1290 | 0.1290 | 0.1290 | 0.1290 | 0.1290 | 0.1290 | 0.1290 |
| Camarilla | 0.1290 | 0.1290 | 0.1290 | 0.1290 | 0.1290 | 0.1290 | 0.1290 |
| Woodie | 0.1290 | 0.1290 | 0.1290 | 0.1290 | 0.1290 | 0.1290 | 0.1290 |
| Fibonacci | 0.1290 | 0.1290 | 0.1290 | 0.1290 | 0.1290 | 0.1290 | 0.1290 |
| Pivot points | S3 | S2 | S1 | PP | R1 | R2 | R3 |
|---|---|---|---|---|---|---|---|
| Standard | 0.1200 | 0.1225 | 0.1260 | 0.1285 | 0.1320 | 0.1345 | 0.1380 |
| Camarilla | 0.1279 | 0.1284 | 0.1290 | 0.1295 | 0.1301 | 0.1306 | 0.1312 |
| Woodie | 0.1205 | 0.1228 | 0.1265 | 0.1288 | 0.1325 | 0.1348 | 0.1385 |
| Fibonacci | 0.1225 | 0.1248 | 0.1262 | 0.1285 | 0.1308 | 0.1322 | 0.1345 |
| Pivot points | S3 | S2 | S1 | PP | R1 | R2 | R3 |
|---|---|---|---|---|---|---|---|
| Standard | 0.1102 | 0.1163 | 0.1232 | 0.1293 | 0.1362 | 0.1423 | 0.1492 |
| Camarilla | 0.1264 | 0.1276 | 0.1288 | 0.1300 | 0.1312 | 0.1324 | 0.1336 |
| Woodie | 0.1105 | 0.1165 | 0.1235 | 0.1295 | 0.1365 | 0.1425 | 0.1495 |
| Fibonacci | 0.1163 | 0.1213 | 0.1244 | 0.1293 | 0.1343 | 0.1374 | 0.1423 |
Numerical data
The following are the details of the technical indicators and moving averages that were collected to generate this technical analysis:
| RSI (14): | 66.02 | |
| MACD (12,26,9): | 0.0001 | |
| Directional Movement: | -3.6166 | |
| AROON (14): | 78.5714 | |
| DEMA (21): | 0.1317 | |
| Parabolic SAR (0,02-0,02-0,2): | 0.1205 | |
| Elder Ray (13): | 0.0004 | |
| Super Trend (3,10): | 0.1180 | |
| Zig ZAG (10): | 0.1375 | |
| VORTEX (21): | 0.8906 | |
| Stochastique (14,3,5): | 73.81 | |
| TEMA (21): | 0.1316 | |
| Williams %R (14): | 0.00 | |
| Chande Momentum Oscillator (20): | 0.0030 | |
| Repulse (5,40,3): | 12.0212 | |
| ROCnROLL: | 1 | |
| TRIX (15,9): | 0.0107 | |
| Courbe Coppock: | 2.39 |
| MA7: | 0.1310 | |
| MA20: | 0.1318 | |
| MA50: | 0.1304 | |
| MA100: | 0.1317 | |
| MAexp7: | 0.1318 | |
| MAexp20: | 0.1315 | |
| MAexp50: | 0.1313 | |
| MAexp100: | 0.1318 | |
| Price / MA7: | +4.96% | |
| Price / MA20: | +4.32% | |
| Price / MA50: | +5.44% | |
| Price / MA100: | +4.40% | |
| Price / MAexp7: | +4.32% | |
| Price / MAexp20: | +4.56% | |
| Price / MAexp50: | +4.72% | |
| Price / MAexp100: | +4.32% |
News
The latest news and videos published on ST DUPONT at the time of the analysis were as follows:
- Simplified tender offer on S.T. Dupont's shares for EUR 0.14 per S.T. Dupont share, followed by a mandatory squeeze-out
- S.T. Dupont : Résultats consolidés au 31 mars 2021
About author
Online


Add a comment
Comments
0 comments on the analysis ST DUPONT - Daily