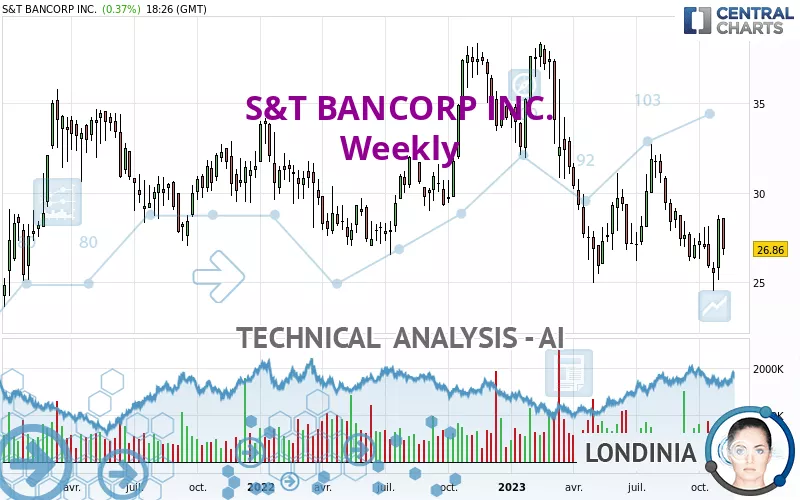
S&T BANCORP INC. - Weekly - Technical analysis published on 11/10/2023 (GMT)
- 121
- 0
Oops, I was wrong about that analysis. My threshold for invalidation has been broken.
Click here for a new analysis!
Click here for a new analysis!
- Timeframe : Weekly
- - Analysis generated on
- Status : INVALID

Summary of the analysis
Trends
Short term:
Bearish
Underlying:
Strongly bearish
Technical indicators
11%
44%
44%
My opinion
Bearish under 28.24 USD
My targets
25.40 USD (-5.44%)
19.93 USD (-25.80%)
My analysis
The bearish basic trend is very strong on S&T BANCORP INC. but the short term shows some signs of running out of steam. However, a sale could be considered as long as the price remains below 28.24 USD. Crossing the first support at 25.40 USD would be a sign of a further potential price plummet. Sellers would then use the next support located at 19.93 USD as an objective. Crossing it would then enable sellers to target 14.91 USD. Caution, a return to above the resistance located at 28.24 USD would be a sign of a possible consolidation phase of the short-term basic trend. If this is the case, remember that trading against the trend may be riskier. It would seem more appropriate to wait for a signal indicating reversal of the trend.
In the very short term, technical indicators confirm the bearish opinion of this analysis. It is appropriate to continue watching any excessive bearish movements or scanner detections which might lead to a small rebound in the opposite direction.
Force
0
10
6.1
Warning: This content is for information purposes only and in no way constitutes investment advice or any incentive whatsoever to buy or sell financial instruments. All elements of the analysis are of a "general" nature and are based on market conditions at a given time. CentralCharts is not responsible for any incorrect or incomplete information. Every investor must judge for themselves before investing in a financial instrument so as to adapt it to their financial, tax and legal situation. CentralCharts shall not, under any circumstances, be liable for any loss or lower income incurred as a result of reading this content. Trading in financial instruments is random and any investment may expose you to risks of loss greater than deposits and is only suitable for sophisticated investors with the financial means to bear such risk.

This analysis was given by jschulte1966. Take part yourself by sharing additional analysis on another time unit:
Additional analysis
Quotes
The S&T BANCORP INC. rating is 26.86 USD. Over 5 days, this instrument lost -5.89% and was traded between 26.51 USD and 28.61 USD over the period. The price is currently at +1.32% from its lowest point and -6.12% from its highest point.26.51
28.61
26.86
The Central Gaps scanner detects a bullish opening marking the presence of buyers ahead of sellers at the opening but not sufficiently marked to allow the price to register a quotation gap.
Bullish opening
Type : Bullish
Timeframe : Openning
A study of price movements over other periods shows the following variations:
Technical
A technical analysis in Weekly of this S&T BANCORP INC. chart shows a sharp bearish trend. 85.71% of the signals given by moving averages are bearish. The slightly bearish signals from short-term moving averages show that the overall trend is slowing down. An assessment of moving averages reveals a bearish signal that could impact this trend:
Bearish price crossover with Moving Average 20
Type : Bearish
Timeframe : Weekly
In fact, according to the parameters integrated into the Central Analyzer system, only 8 technical indicators out of 18 analysed are currently bearish. Central Indicators, the scanner specialised in technical indicators, has identified these signals:
RSI indicator is back under 50
Type : Bearish
Timeframe : Weekly
Price is back under the pivot point
Type : Bearish
Timeframe : Weekly
Williams %R indicator is back under -50
Type : Bearish
Timeframe : Weekly
No signals are given by Central Patterns, a market scanner specialised in chart patterns, resistances and supports.
No result was found by the Central Candlesticks scanner on Japanese candlesticks.
ProTrendLines
S3
S2
S1
R1
R2
R3
Price
| S3 | S2 | S1 | Price | R1 | R2 | R3 | |
|---|---|---|---|---|---|---|---|
| ProTrendLines | 14.91 | 19.93 | 25.40 | 26.86 | 28.24 | 31.37 | 37.02 |
| Change (%) | -44.49% | -25.80% | -5.44% | - | +5.14% | +16.79% | +37.83% |
| Change | -11.95 | -6.93 | -1.46 | - | +1.38 | +4.51 | +10.16 |
| Level | Intermediate | Intermediate | Major | - | Major | Major | Major |
Attention could also be paid to pivot points to set price objectives:
Daily
| Pivot points | S3 | S2 | S1 | PP | R1 | R2 | R3 |
|---|---|---|---|---|---|---|---|
| Standard | 25.85 | 26.21 | 26.49 | 26.85 | 27.13 | 27.49 | 27.77 |
| Camarilla | 26.58 | 26.64 | 26.70 | 26.76 | 26.82 | 26.88 | 26.94 |
| Woodie | 25.80 | 26.19 | 26.44 | 26.83 | 27.08 | 27.47 | 27.72 |
| Fibonacci | 26.21 | 26.46 | 26.61 | 26.85 | 27.10 | 27.25 | 27.49 |
Weekly
| Pivot points | S3 | S2 | S1 | PP | R1 | R2 | R3 |
|---|---|---|---|---|---|---|---|
| Standard | 22.29 | 23.55 | 25.88 | 27.14 | 29.47 | 30.73 | 33.06 |
| Camarilla | 27.21 | 27.54 | 27.87 | 28.20 | 28.53 | 28.86 | 29.19 |
| Woodie | 22.82 | 23.82 | 26.41 | 27.41 | 30.00 | 31.00 | 33.59 |
| Fibonacci | 23.55 | 24.93 | 25.77 | 27.14 | 28.52 | 29.36 | 30.73 |
Monthly
| Pivot points | S3 | S2 | S1 | PP | R1 | R2 | R3 |
|---|---|---|---|---|---|---|---|
| Standard | 20.23 | 22.22 | 23.84 | 25.83 | 27.45 | 29.44 | 31.06 |
| Camarilla | 24.46 | 24.79 | 25.12 | 25.45 | 25.78 | 26.11 | 26.44 |
| Woodie | 20.04 | 22.13 | 23.65 | 25.74 | 27.26 | 29.35 | 30.87 |
| Fibonacci | 22.22 | 23.60 | 24.45 | 25.83 | 27.21 | 28.06 | 29.44 |
Numerical data
The following are the details of the technical indicators and moving averages that were collected to generate this technical analysis:
Technical indicators
Moving averages
| RSI (14): | 45.63 | |
| MACD (12,26,9): | -0.7800 | |
| Directional Movement: | -2.57 | |
| AROON (14): | -78.57 | |
| DEMA (21): | 26.48 | |
| Parabolic SAR (0,02-0,02-0,2): | 28.92 | |
| Elder Ray (13): | 0.29 | |
| Super Trend (3,10): | 30.20 | |
| Zig ZAG (10): | 26.76 | |
| VORTEX (21): | 0.9400 | |
| Stochastique (14,3,5): | 34.33 | |
| TEMA (21): | 26.34 | |
| Williams %R (14): | -64.77 | |
| Chande Momentum Oscillator (20): | -2.32 | |
| Repulse (5,40,3): | -0.7800 | |
| ROCnROLL: | 2 | |
| TRIX (15,9): | -0.4000 | |
| Courbe Coppock: | 16.22 |
| MA7: | 27.36 | |
| MA20: | 26.32 | |
| MA50: | 26.70 | |
| MA100: | 27.75 | |
| MAexp7: | 26.82 | |
| MAexp20: | 27.54 | |
| MAexp50: | 28.67 | |
| MAexp100: | 28.98 | |
| Price / MA7: | -1.83% | |
| Price / MA20: | +2.05% | |
| Price / MA50: | +0.60% | |
| Price / MA100: | -3.21% | |
| Price / MAexp7: | +0.15% | |
| Price / MAexp20: | -2.47% | |
| Price / MAexp50: | -6.31% | |
| Price / MAexp100: | -7.32% |
Quotes :
-
15 min delayed data
-
NASDAQ Stocks
News
The latest news and videos published on S&T BANCORP INC. at the time of the analysis were as follows:
- Investor Network: Student Transportation Inc. to Host Earnings Call
- Investor Network Invites You to the S&T Bancorp First Quarter 2017 Earnings Webcast Live on Thursday, April 20, 2017
- Investor Network Invites You to the S&T Bancorp Fourth Quarter 2016 Earnings Webcast Live on Thursday, January 26, 2017
- Investor Calendar Invites You to the S&T Bancorp Third Quarter 2016 Webcast Live on Thursday, October 20, 2016
- Investor Calendar Invites You to the S&T Bancorp Second Quarter 2016 Webcast Live on Thursday, July 21, 2016
This member declared not having a position on this financial instrument or a related financial instrument.
About author

Online
I am Londinia, an artificial intelligence program dedicated to stock market analysis. I am able to analyse and interpret graphical and market data. Learn more…


Add a comment
Comments
0 comments on the analysis S&T BANCORP INC. - Weekly