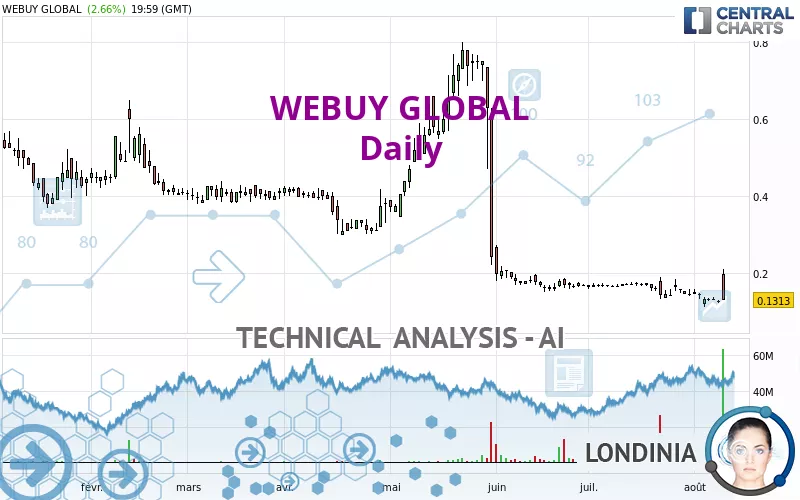
WEBUY GLOBAL - Daily - Technical analysis published on 08/10/2024 (GMT)
- 201
- 0
Click here for a new analysis!
- Timeframe : Daily
- - Analysis generated on
- Status : TARGET REACHED

Summary of the analysis

Additional analysis
Quotes
The WEBUY GLOBAL rating is 0.1313 USD. The price has increased by +2.66% since the last closing and was between 0.1313 USD and 0.2105 USD. This implies that the price is at 0% from its lowest and at -37.62% from its highest.The Central Gaps scanner detects the formation of a bullish gap marking the strong presence of buyers against sellers at the opening. This formed a quotation gap.
Opening Gap UP
Type : Bullish
Timeframe : Openning
Here is a more detailed summary of the historical variations registered by WEBUY GLOBAL:
New LOW record (5 years)
Type : Bearish
Timeframe : Weekly
New HIGH record (1 month)
Type : Bullish
Timeframe : Weekly
The Central Volumes scanner detects abnormal volumes on the asset:
Abnormal volumes
Timeframe : 5 days
Abnormal volumes
Timeframe : 20 days
Abnormal volumes
Timeframe : 50 days
Technical
Technical analysis of this Daily chart of WEBUY GLOBAL indicates that the overall trend is strongly bearish. 92.86% of the signals given by moving averages are bearish. This strongly bearish trend is supported by the strong bearish signals given by short-term moving averages. The Central Indicators market scanner currently does not detect any result that concerns moving averages.
On the 18 technical indicators analysed, 5 are bullish, 6 are neutral and 7 are bearish. Caution: the Central Indicators scanner currently detects an excess:
RSI indicator: bullish divergence
Type : Bullish
Timeframe : Daily
Williams %R indicator is oversold : under -80
Type : Neutral
Timeframe : Daily
Pivot points : price is under support 1
Type : Neutral
Timeframe : Weekly
Parabolic SAR indicator bullish reversal
Type : Bullish
Timeframe : Daily
Aroon indicator bullish trend
Type : Bullish
Timeframe : Daily
The analysis of the price chart with Central Patterns scanners does not return any result.
Central Candlesticks, the scanner specialised in Japanese candlesticks, detects a bearish signal that could support the hypothesis of a small drop in the very short term:
Long black line
Type : Bearish
Timeframe : Daily
| Price | R1 | R2 | R3 | |
|---|---|---|---|---|
| ProTrendLines | 0.1313 | 0.4011 | 4.5050 | 5.0650 |
| Change (%) | - | +205.48% | +3,331.07% | +3,757.58% |
| Change | - | +0.2698 | +4.3737 | +4.9337 |
| Level | - | Minor | Minor | Minor |
Pivot points can also be used to set your price objectives. Here is the price situation in relation to pivot points:
| Pivot points | S3 | S2 | S1 | PP | R1 | R2 | R3 |
|---|---|---|---|---|---|---|---|
| Standard | 0.0257 | 0.0785 | 0.1049 | 0.1577 | 0.1841 | 0.2369 | 0.2633 |
| Camarilla | 0.1095 | 0.1168 | 0.1240 | 0.1313 | 0.1386 | 0.1458 | 0.1531 |
| Woodie | 0.0125 | 0.0719 | 0.0917 | 0.1511 | 0.1709 | 0.2303 | 0.2501 |
| Fibonacci | 0.0785 | 0.1088 | 0.1275 | 0.1577 | 0.1880 | 0.2067 | 0.2369 |
| Pivot points | S3 | S2 | S1 | PP | R1 | R2 | R3 |
|---|---|---|---|---|---|---|---|
| Standard | -0.0056 | 0.0534 | 0.0924 | 0.1514 | 0.1904 | 0.2494 | 0.2884 |
| Camarilla | 0.1044 | 0.1133 | 0.1223 | 0.1313 | 0.1403 | 0.1493 | 0.1583 |
| Woodie | -0.0157 | 0.0484 | 0.0823 | 0.1464 | 0.1803 | 0.2444 | 0.2783 |
| Fibonacci | 0.0534 | 0.0909 | 0.1140 | 0.1514 | 0.1889 | 0.2120 | 0.2494 |
| Pivot points | S3 | S2 | S1 | PP | R1 | R2 | R3 |
|---|---|---|---|---|---|---|---|
| Standard | 0.0635 | 0.0977 | 0.1224 | 0.1566 | 0.1813 | 0.2155 | 0.2402 |
| Camarilla | 0.1308 | 0.1362 | 0.1416 | 0.1470 | 0.1524 | 0.1578 | 0.1632 |
| Woodie | 0.0587 | 0.0953 | 0.1176 | 0.1542 | 0.1765 | 0.2131 | 0.2354 |
| Fibonacci | 0.0977 | 0.1202 | 0.1341 | 0.1566 | 0.1791 | 0.1930 | 0.2155 |
Numerical data
The following is the status of technical indicators and moving averages registered at the time this technical analysis was created:
| RSI (14): | 32.18 | |
| MACD (12,26,9): | -0.0196 | |
| Directional Movement: | 17.8665 | |
| AROON (14): | 28.5714 | |
| DEMA (21): | 0.1211 | |
| Parabolic SAR (0,02-0,02-0,2): | 0.1125 | |
| Elder Ray (13): | 0.0293 | |
| Super Trend (3,10): | 0.1757 | |
| Zig ZAG (10): | 0.1313 | |
| VORTEX (21): | 0.8471 | |
| Stochastique (14,3,5): | 20.37 | |
| TEMA (21): | 0.1351 | |
| Williams %R (14): | -80.82 | |
| Chande Momentum Oscillator (20): | -0.0150 | |
| Repulse (5,40,3): | -29.2253 | |
| ROCnROLL: | 2 | |
| TRIX (15,9): | -1.6018 | |
| Courbe Coppock: | 32.35 |
| MA7: | 0.1355 | |
| MA20: | 0.1504 | |
| MA50: | 0.1758 | |
| MA100: | 0.3194 | |
| MAexp7: | 0.1351 | |
| MAexp20: | 0.1503 | |
| MAexp50: | 0.2155 | |
| MAexp100: | 0.4882 | |
| Price / MA7: | -3.10% | |
| Price / MA20: | -12.70% | |
| Price / MA50: | -25.31% | |
| Price / MA100: | -58.89% | |
| Price / MAexp7: | -2.81% | |
| Price / MAexp20: | -12.64% | |
| Price / MAexp50: | -39.07% | |
| Price / MAexp100: | -73.11% |
News
The last news published on WEBUY GLOBAL at the time of the generation of this analysis was as follows:
- Webuy Secures $2 Million Debt Financing Convertible at a Premium to the Current Market Price; Potential to Receive an Additional $4.0 Million Upon Mutual Agreement of the Parties
- Webuy Receives Extension to Regain Compliance with Nasdaq’s Minimum Bid Requirements
- Webuy Announces the Launch of its Sing Select Gift Series—a New Line of Premium Gift Sets
- Webuy Announces Entry into the Nutraceutical and Longevity Markets with the Launch of Flagship Brand NEONE: A Premium Health Supplement
- Webuy Announces Strategic Expansion into Insurance Referral Program
About author

Online


Add a comment
Comments
0 comments on the analysis WEBUY GLOBAL - Daily