| Open: | - |
| Change: | - |
| Volume: | - |
| Low: | - |
| High: | - |
| High / Low range: | - |
| Type: | Cryptocurrencies |
| Ticker: | COSUSD |
| ISIN: |
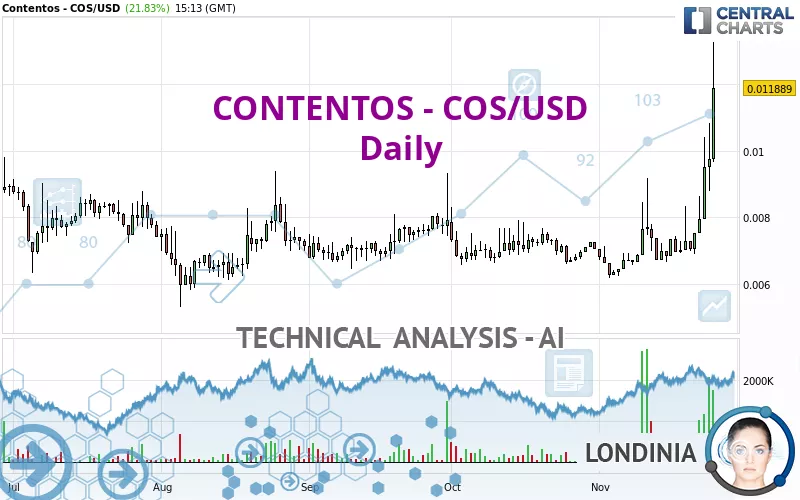
CONTENTOS - COS/USD - Daily - Technical analysis published on 11/25/2024 (GMT)
- 118
- 0
- 11/25/2024 - 15:17
Click here for a new analysis!
- Timeframe : Daily
- - Analysis generated on 11/25/2024 - 15:17
- Status : TARGET REACHED
Summary of the analysis

Additional analysis
Quotes
The CONTENTOS - COS/USD price is 0.011889 USD. The price registered an increase of +21.83% on the session with the lowest point at 0.009646 USD and the highest point at 0.013252 USD. The deviation from the price is +23.25% for the low point and -10.29% for the high point.A study of price movements over other periods shows the following variations:
New HIGH record (1st january)
Type : Bullish
Timeframe : Weekly
New HIGH record (1 month)
Type : Bullish
Timeframe : Weekly
Technical
Technical analysis of CONTENTOS - COS/USD in Daily shows a strongly overall bullish trend. The signals given by the moving averages are 85.71% bullish. This strong bullish trend is confirmed by the strong signals currently being given by short-term moving averages. The Central Indicators scanner does not detect any result on moving averages that would impact this trend.
In fact, 17 technical indicators on 18 studied are currently bullish. Caution: the Central Indicators scanner currently detects an excess:
RSI indicator is overbought : over 80
Type : Neutral
Timeframe : Daily
CCI indicator is overbought : over 100
Type : Neutral
Timeframe : Daily
Williams %R indicator is overbought : over -20
Type : Neutral
Timeframe : Daily
Pivot points : price is over resistance 1
Type : Neutral
Timeframe : Weekly
Pivot points : price is over resistance 2
Type : Neutral
Timeframe : Daily
No signals are given by Central Patterns, a market scanner specialised in chart patterns, resistances and supports.
For a small rebound in the very short term, the Central Candlesticks scanner currently notes the presence of this bullish pattern in Japanese candlesticks:
Long white line
Type : Bullish
Timeframe : Daily
| S3 | S2 | S1 | Price | R1 | |
|---|---|---|---|---|---|
| ProTrendLines | 0.008093 | 0.009397 | 0.010837 | 0.011889 | 0.013080 |
| Change (%) | -31.93% | -20.96% | -8.85% | - | +10.02% |
| Change | -0.003796 | -0.002492 | -0.001052 | - | +0.001191 |
| Level | Major | Minor | Minor | - | Intermediate |
Attention could also be paid to pivot points to set price objectives:
| Pivot points | S3 | S2 | S1 | PP | R1 | R2 | R3 |
|---|---|---|---|---|---|---|---|
| Standard | 0.006689 | 0.007735 | 0.008747 | 0.009793 | 0.010805 | 0.011851 | 0.012863 |
| Camarilla | 0.009193 | 0.009382 | 0.009570 | 0.009759 | 0.009948 | 0.010136 | 0.010325 |
| Woodie | 0.006672 | 0.007727 | 0.008730 | 0.009785 | 0.010788 | 0.011843 | 0.012846 |
| Fibonacci | 0.007735 | 0.008521 | 0.009007 | 0.009793 | 0.010579 | 0.011065 | 0.011851 |
| Pivot points | S3 | S2 | S1 | PP | R1 | R2 | R3 |
|---|---|---|---|---|---|---|---|
| Standard | 0.003978 | 0.005443 | 0.007482 | 0.008947 | 0.010986 | 0.012451 | 0.014490 |
| Camarilla | 0.008556 | 0.008878 | 0.009199 | 0.009520 | 0.009841 | 0.010162 | 0.010484 |
| Woodie | 0.004264 | 0.005587 | 0.007768 | 0.009091 | 0.011272 | 0.012595 | 0.014776 |
| Fibonacci | 0.005443 | 0.006782 | 0.007609 | 0.008947 | 0.010286 | 0.011113 | 0.012451 |
| Pivot points | S3 | S2 | S1 | PP | R1 | R2 | R3 |
|---|---|---|---|---|---|---|---|
| Standard | 0.005142 | 0.005878 | 0.006463 | 0.007199 | 0.007784 | 0.008520 | 0.009105 |
| Camarilla | 0.006684 | 0.006805 | 0.006926 | 0.007047 | 0.007168 | 0.007289 | 0.007410 |
| Woodie | 0.005066 | 0.005840 | 0.006387 | 0.007161 | 0.007708 | 0.008482 | 0.009029 |
| Fibonacci | 0.005878 | 0.006383 | 0.006695 | 0.007199 | 0.007704 | 0.008016 | 0.008520 |
Numerical data
The following is the status of the technical indicators and moving averages at the time of publication of this technical analysis:
| RSI (14): | 83.17 | |
| MACD (12,26,9): | 0.0008 | |
| Directional Movement: | 47.185460 | |
| AROON (14): | 71.428571 | |
| DEMA (21): | 0.008829 | |
| Parabolic SAR (0,02-0,02-0,2): | 0.006896 | |
| Elder Ray (13): | 0.002953 | |
| Super Trend (3,10): | 0.007829 | |
| Zig ZAG (10): | 0.012177 | |
| VORTEX (21): | 1.1716 | |
| Stochastique (14,3,5): | 78.03 | |
| TEMA (21): | 0.009524 | |
| Williams %R (14): | -16.30 | |
| Chande Momentum Oscillator (20): | 0.005436 | |
| Repulse (5,40,3): | 29.8528 | |
| ROCnROLL: | 1 | |
| TRIX (15,9): | 0.5330 | |
| Courbe Coppock: | 54.02 |
| MA7: | 0.008713 | |
| MA20: | 0.007644 | |
| MA50: | 0.007251 | |
| MA100: | 0.007271 | |
| MAexp7: | 0.009259 | |
| MAexp20: | 0.008049 | |
| MAexp50: | 0.007499 | |
| MAexp100: | 0.007545 | |
| Price / MA7: | +36.45% | |
| Price / MA20: | +55.53% | |
| Price / MA50: | +63.96% | |
| Price / MA100: | +63.51% | |
| Price / MAexp7: | +28.40% | |
| Price / MAexp20: | +47.71% | |
| Price / MAexp50: | +58.54% | |
| Price / MAexp100: | +57.57% |
About author

Online


Add a comment
Comments
0 comments on the analysis CONTENTOS - COS/USD - Daily