REPUBLIC FIRST BANCORP INC. - Daily - Technical analysis published on 03/31/2023 (GMT)
- 147
- 0
Click here for a new analysis!
- Timeframe : Daily
- - Analysis generated on
- Status : INVALID
Summary of the analysis
Additional analysis
Quotes
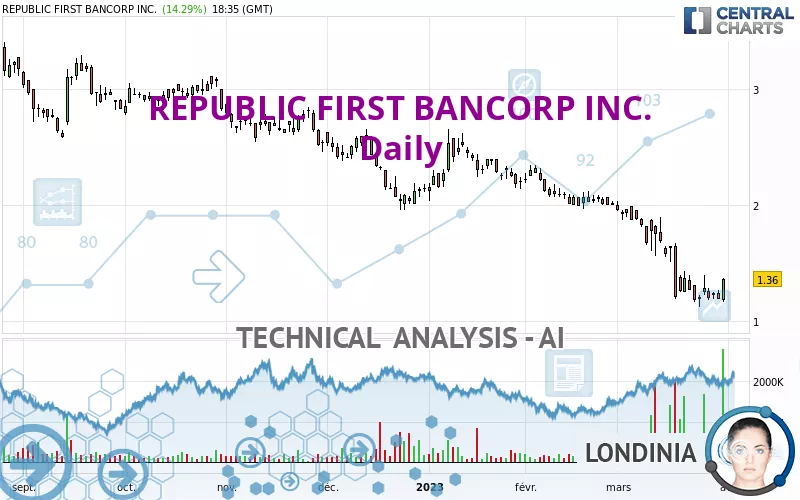
The REPUBLIC FIRST BANCORP INC. price is 1.36 USD. The price registered an increase of +14.29% on the session and was traded between 1.16 USD and 1.37 USD over the period. The price is currently at +17.24% from its lowest and -0.73% from its highest.A bearish gap was detected at the opening by the Central Gaps scanner. There are a lot of sellers and they have the upper hand in the very short term.
Opening Gap DOWN
Type : Bearish
Timeframe : Openning
A study of price movements over other periods shows the following variations:
Near a new LOW record (5 years)
Type : Bearish
Timeframe : Weekly
Near a new LOW record (1 year)
Type : Bearish
Timeframe : Weekly
Near a new LOW record (1st january)
Type : Bearish
Timeframe : Weekly
Near a new LOW record (1 month)
Type : Bearish
Timeframe : Weekly
The Central Volumes scanner notes the presence of abnormal volumes:
Abnormal volumes
Timeframe : 5 days
Abnormal volumes
Timeframe : 20 days
Technical
A technical analysis in Daily of this REPUBLIC FIRST BANCORP INC. chart shows a sharp bearish trend. The signals given by moving averages are 92.86% bearish. This strong bearish trend is confirmed by the strong signals currently being given by short-term moving averages. The Central Indicators market scanner currently does not detect any result that concerns moving averages.
The technical indicators are generally neutral. They do not provide relevant information on the direction of future price movements.
Central Indicators, the detector scanner for these technical indicators has recently detected several signals:
Pivot points : price is over resistance 3
Type : Neutral
Timeframe : Daily
MACD crosses UP its Moving Average
Type : Bullish
Timeframe : Daily
The analysis of the price chart with Central Patterns scanners does not return any result.
Central Candlesticks, the scanner specialised in Japanese candlesticks, detects a bullish signal that could support the hypothesis of a small rebound in the very short term:
Bullish engulfing lines
Type : Bullish
Timeframe : Daily
| S1 | Price | R1 | R2 | R3 | |
|---|---|---|---|---|---|
| ProTrendLines | 1.15 | 1.36 | 1.89 | 2.59 | 2.93 |
| Change (%) | -15.44% | - | +38.97% | +90.44% | +115.44% |
| Change | -0.21 | - | +0.53 | +1.23 | +1.57 |
| Level | Major | - | Major | Intermediate | Intermediate |
To determine price objectives, it is also possible to use the pivot points. Here is the price position in relation to pivot points:
| Pivot points | S3 | S2 | S1 | PP | R1 | R2 | R3 |
|---|---|---|---|---|---|---|---|
| Standard | 1.08 | 1.14 | 1.16 | 1.22 | 1.24 | 1.30 | 1.32 |
| Camarilla | 1.17 | 1.18 | 1.18 | 1.19 | 1.20 | 1.21 | 1.21 |
| Woodie | 1.07 | 1.13 | 1.15 | 1.21 | 1.23 | 1.29 | 1.31 |
| Fibonacci | 1.14 | 1.17 | 1.19 | 1.22 | 1.25 | 1.27 | 1.30 |
| Pivot points | S3 | S2 | S1 | PP | R1 | R2 | R3 |
|---|---|---|---|---|---|---|---|
| Standard | 0.75 | 0.94 | 1.06 | 1.25 | 1.37 | 1.56 | 1.68 |
| Camarilla | 1.11 | 1.13 | 1.16 | 1.19 | 1.22 | 1.25 | 1.28 |
| Woodie | 0.73 | 0.92 | 1.04 | 1.23 | 1.35 | 1.54 | 1.66 |
| Fibonacci | 0.94 | 1.06 | 1.13 | 1.25 | 1.37 | 1.44 | 1.56 |
| Pivot points | S3 | S2 | S1 | PP | R1 | R2 | R3 |
|---|---|---|---|---|---|---|---|
| Standard | 1.48 | 1.73 | 1.86 | 2.11 | 2.24 | 2.49 | 2.62 |
| Camarilla | 1.90 | 1.93 | 1.97 | 2.00 | 2.04 | 2.07 | 2.11 |
| Woodie | 1.43 | 1.70 | 1.81 | 2.08 | 2.19 | 2.46 | 2.57 |
| Fibonacci | 1.73 | 1.87 | 1.96 | 2.11 | 2.25 | 2.34 | 2.49 |
Numerical data
The following are the details of the technical indicators and moving averages that were collected to generate this technical analysis:
| RSI (14): | 38.79 | |
| MACD (12,26,9): | -0.2000 | |
| Directional Movement: | -8.88 | |
| AROON (14): | -57.15 | |
| DEMA (21): | 1.18 | |
| Parabolic SAR (0,02-0,02-0,2): | 1.14 | |
| Elder Ray (13): | -0.09 | |
| Super Trend (3,10): | 1.66 | |
| Zig ZAG (10): | 1.31 | |
| VORTEX (21): | 0.7700 | |
| Stochastique (14,3,5): | 16.88 | |
| TEMA (21): | 1.13 | |
| Williams %R (14): | -73.08 | |
| Chande Momentum Oscillator (20): | -0.25 | |
| Repulse (5,40,3): | 5.8400 | |
| ROCnROLL: | 2 | |
| TRIX (15,9): | -1.6200 | |
| Courbe Coppock: | 58.23 |
| MA7: | 1.23 | |
| MA20: | 1.47 | |
| MA50: | 1.87 | |
| MA100: | 2.16 | |
| MAexp7: | 1.28 | |
| MAexp20: | 1.45 | |
| MAexp50: | 1.77 | |
| MAexp100: | 2.12 | |
| Price / MA7: | +10.57% | |
| Price / MA20: | -7.48% | |
| Price / MA50: | -27.27% | |
| Price / MA100: | -37.04% | |
| Price / MAexp7: | +6.25% | |
| Price / MAexp20: | -6.21% | |
| Price / MAexp50: | -23.16% | |
| Price / MAexp100: | -35.85% |
News
Don't forget to follow the news on REPUBLIC FIRST BANCORP INC.. At the time of publication of this analysis, the latest news was as follows:
- The Philadelphia Inquirer Names Republic Bank a 2023 Top Workplace
- Republic First Bancorp, Inc. Receives Compliance Notice and New Notice of Non-Compliance from Nasdaq
- Republic First Announces $125 Million Equity Capital Raise to Support Execution of Strategic Plan to Drive Profitability and Enhance Shareholder Value
- Republic First Addresses Norcross-Braca Group’s Unwillingness to Participate in the Company’s Full and Fair Strategic Review
- Republic Bank Appoints Michael LaPlante as Senior Vice President, Chief Accounting Officer
About author

Online


Add a comment
Comments
0 comments on the analysis REPUBLIC FIRST BANCORP INC. - Daily