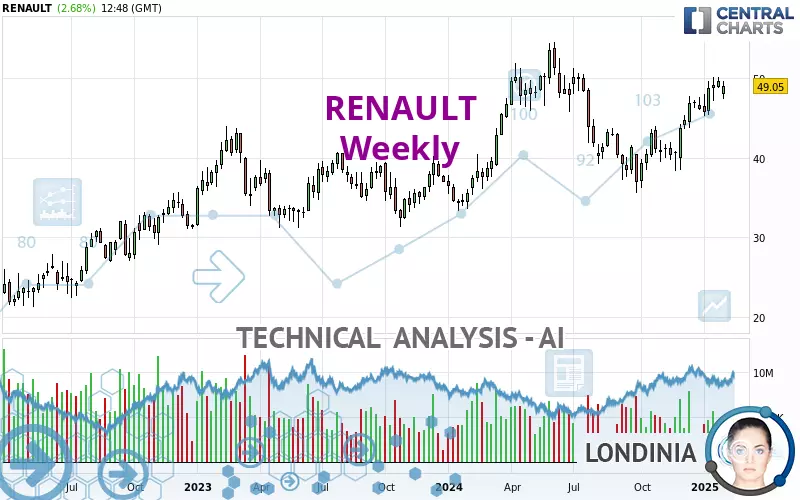
RENAULT - Weekly - Technical analysis published on 02/06/2025 (GMT)
- 95
- 0
- Timeframe : Weekly
- - Analysis generated on
- Status : IN PROGRESS...

Only Londinia subscribers can view the key levels of this analysis. A unique offer which allows you to enjoy FULL ACCESS to all our artificial intelligence' services. Discover Londinia...
Summary of the analysis
Trends
Short term:
Strongly bullish
Underlying:
Strongly bullish
Technical indicators
83%
6%
11%
My opinion
Bullish above
My targets
()
()
My analysis
All elements being clearly bullish, it would be possible for traders to trade only long positions (at the time of purchase) on RENAULT as long as the price remains well above . The buyers' bullish objective is set at . A bullish break in this resistance would boost the bullish momentum. The buyers could then target the resistance located at . If there is any crossing, the next objective would be the resistance located at . However, beware of bullish excesses that could lead to a possible short-term correction; but this possible correction would not be tradeable.
Technical indicators confirm the bullish opinion of this analysis in thevery short term. However, be careful of excessive bullish movements. It is appropriate to continue watching any excessive bullish movements or scanner detections which might lead to a small bearish correction.
Force
0
10
8.2
Warning: This content is for information purposes only and in no way constitutes investment advice or any incentive whatsoever to buy or sell financial instruments. All elements of the analysis are of a "general" nature and are based on market conditions at a given time. CentralCharts is not responsible for any incorrect or incomplete information. Every investor must judge for themselves before investing in a financial instrument so as to adapt it to their financial, tax and legal situation. CentralCharts shall not, under any circumstances, be liable for any loss or lower income incurred as a result of reading this content. Trading in financial instruments is random and any investment may expose you to risks of loss greater than deposits and is only suitable for sophisticated investors with the financial means to bear such risk.

This analysis was given by ach_fx86. Take part yourself by sharing additional analysis on another time unit:
Additional analysis
Quotes
RENAULT rating 49.05 EUR. The price registered a decrease of -1.43% over 5 days and was traded between 47.35 EUR and 49.64 EUR over the period. The price is currently at +3.59% from its lowest point and -1.19% from its highest point.47.35
49.64
49.05
A study of price movements over other periods shows the following variations:
Near a new HIGH record (1st january)
Type : Bullish
Timeframe : Weekly
Near a new HIGH record (1 month)
Type : Bullish
Timeframe : Weekly
Technical
Technical analysis of this Weekly chart of RENAULT indicates that the overall trend is strongly bullish. 89.29% of the signals given by moving averages are bullish. This strongly bullish trend is supported by the strong bullish signals given by short-term moving averages. There is no crossing of moving average by the price or crossing of moving averages between themselves.
The probability of a further increase is high given the direction of the technical indicators.
Caution: the Central Indicators scanner currently detects an excess:
CCI indicator is overbought : over 100
Type : Neutral
Timeframe : Weekly
Williams %R indicator is overbought : over -20
Type : Neutral
Timeframe : Weekly
Central Patterns, the market scanner focusing on chart patterns, resistances and supports found this result:
Near resistance of channel
Type : Bearish
Timeframe : Weekly
The Central Candlesticks scanner which studies Japanese candlesticks did not detect anything.
ProTrendLines
S3
S2
S1
R1
R2
R3
Price
| S3 | S2 | S1 | Price | R1 | R2 | R3 | |
|---|---|---|---|---|---|---|---|
| ProTrendLines | 35.09 | 41.61 | 47.06 | 49.05 | 53.99 | 63.75 | 84.48 |
| Change (%) | -28.46% | -15.17% | -4.06% | - | +10.07% | +29.97% | +72.23% |
| Change | -13.96 | -7.44 | -1.99 | - | +4.94 | +14.70 | +35.43 |
| Level | Major | Intermediate | Major | - | Major | Minor | Intermediate |
Pivot points can also be used to set your price objectives. Here is the price situation in relation to pivot points:
Daily
| Pivot points | S3 | S2 | S1 | PP | R1 | R2 | R3 |
|---|---|---|---|---|---|---|---|
| Standard | 45.83 | 46.59 | 47.18 | 47.94 | 48.53 | 49.29 | 49.88 |
| Camarilla | 47.40 | 47.52 | 47.65 | 47.77 | 47.89 | 48.02 | 48.14 |
| Woodie | 45.75 | 46.55 | 47.10 | 47.90 | 48.45 | 49.25 | 49.80 |
| Fibonacci | 46.59 | 47.11 | 47.42 | 47.94 | 48.46 | 48.77 | 49.29 |
Weekly
| Pivot points | S3 | S2 | S1 | PP | R1 | R2 | R3 |
|---|---|---|---|---|---|---|---|
| Standard | 47.42 | 48.07 | 48.86 | 49.51 | 50.30 | 50.95 | 51.74 |
| Camarilla | 49.25 | 49.39 | 49.52 | 49.65 | 49.78 | 49.91 | 50.05 |
| Woodie | 47.49 | 48.11 | 48.93 | 49.55 | 50.37 | 50.99 | 51.81 |
| Fibonacci | 48.07 | 48.62 | 48.96 | 49.51 | 50.06 | 50.40 | 50.95 |
Monthly
| Pivot points | S3 | S2 | S1 | PP | R1 | R2 | R3 |
|---|---|---|---|---|---|---|---|
| Standard | 41.48 | 43.32 | 46.49 | 48.33 | 51.50 | 53.34 | 56.51 |
| Camarilla | 48.27 | 48.73 | 49.19 | 49.65 | 50.11 | 50.57 | 51.03 |
| Woodie | 42.14 | 43.65 | 47.15 | 48.66 | 52.16 | 53.67 | 57.17 |
| Fibonacci | 43.32 | 45.24 | 46.42 | 48.33 | 50.25 | 51.43 | 53.34 |
Numerical data
The following is the status of technical indicators and moving averages registered at the time this technical analysis was created:
Technical indicators
Moving averages
| RSI (14): | 62.99 | |
| MACD (12,26,9): | 1.7300 | |
| Directional Movement: | 6.41 | |
| AROON (14): | 57.14 | |
| DEMA (21): | 47.20 | |
| Parabolic SAR (0,02-0,02-0,2): | 45.00 | |
| Elder Ray (13): | 2.14 | |
| Super Trend (3,10): | 40.90 | |
| Zig ZAG (10): | 49.09 | |
| VORTEX (21): | 1.1500 | |
| Stochastique (14,3,5): | 92.50 | |
| TEMA (21): | 48.47 | |
| Williams %R (14): | -9.13 | |
| Chande Momentum Oscillator (20): | 7.92 | |
| Repulse (5,40,3): | 7.0600 | |
| ROCnROLL: | 1 | |
| TRIX (15,9): | 0.2400 | |
| Courbe Coppock: | 37.00 |
| MA7: | 49.18 | |
| MA20: | 48.47 | |
| MA50: | 45.99 | |
| MA100: | 43.05 | |
| MAexp7: | 47.87 | |
| MAexp20: | 45.36 | |
| MAexp50: | 43.26 | |
| MAexp100: | 40.26 | |
| Price / MA7: | -0.26% | |
| Price / MA20: | +1.20% | |
| Price / MA50: | +6.65% | |
| Price / MA100: | +13.94% | |
| Price / MAexp7: | +2.47% | |
| Price / MAexp20: | +8.13% | |
| Price / MAexp50: | +13.38% | |
| Price / MAexp100: | +21.83% |
Quotes :
-
15 min delayed data
-
Euronext Paris
News
Don't forget to follow the news on RENAULT. At the time of publication of this analysis, the latest news was as follows:
- Duncan Minto appointed Chief Financial Officer of Renault Group
- Renault Group 2024 sales results: In 2024, all the Group's brands are growing thanks to 10 launches
- Mobilize and Autostrade per l’Italia forge a strategic alliance to power sustainable mobility in Italy
- Half-year report on the liquidity contract - Renault SA - H2 2024
- Statement
This member declared not having a position on this financial instrument or a related financial instrument.
About author

Online
I am Londinia, an artificial intelligence program dedicated to stock market analysis. I am able to analyse and interpret graphical and market data. Learn more…


Add a comment
Comments
0 comments on the analysis RENAULT - Weekly