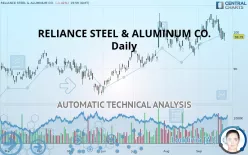
RELIANCE INC. - Daily - Technical analysis published on 09/27/2019 (GMT)
- 206
- 0
- Who voted?
Click here for a new analysis!
- Timeframe : Daily
- - Analysis generated on
- Status : TARGET REACHED

Summary of the analysis

Additional analysis
Quotes
The RELIANCE STEEL & ALUMINUM CO. rating is 98.79 USD. The price is lower by -1.41% since the last closing and was traded between 97.58 USD and 99.78 USD over the period. The price is currently at +1.24% from its lowest and -0.99% from its highest.The Central Gaps scanner detects a bearish opening marking the presence of sellers ahead of buyers at the opening but not sufficiently marked to allow the price to register a quotation gap.
Bearish opening
Type : Bearish
Timeframe : Openning
A study of price movements over other periods shows the following variations:
Near a new HIGH record (5 years)
Type : Bullish
Timeframe : Weekly
Near a new LOW record (1 month)
Type : Bearish
Timeframe : Weekly
Technical
Technical analysis of this Daily chart of RELIANCE STEEL & ALUMINUM CO. indicates that the overall trend is bullish. 75% of the signals given by moving averages are bullish. Caution: the neutral signals currently given by short-term moving averages show us that the global trend is losing momentum. An assessment of moving averages reveals a bullish signal that could impact this trend:
Bullish price crossover with adaptative moving average 20
Type : Bullish
Timeframe : Daily
The probability of a further decline is low given the direction of the technical indicators.
Other results related to technical indicators were also found by the Central Indicators scanner:
Pivot points : price is under support 1
Type : Neutral
Timeframe : Weekly
RSI indicator is back over 50
Type : Bullish
Timeframe : Daily
Price is back over the pivot point
Type : Bullish
Timeframe : Daily
No signals are given by Central Patterns, a market scanner specialised in chart patterns, resistances and supports.
No result was found by the Central Candlesticks scanner on Japanese candlesticks.
| S3 | S2 | S1 | Price | R1 | R2 | |
|---|---|---|---|---|---|---|
| ProTrendLines | 83.18 | 90.70 | 96.56 | 98.79 | 100.20 | 103.00 |
| Change (%) | -15.80% | -8.19% | -2.26% | - | +1.43% | +4.26% |
| Change | -15.61 | -8.09 | -2.23 | - | +1.41 | +4.21 |
| Level | Major | Intermediate | Major | - | Minor | Major |
To determine price objectives, it is also possible to use the pivot points. Here is the price position in relation to pivot points:
| Pivot points | S3 | S2 | S1 | PP | R1 | R2 | R3 |
|---|---|---|---|---|---|---|---|
| Standard | 96.27 | 97.16 | 98.68 | 99.57 | 101.09 | 101.98 | 103.50 |
| Camarilla | 99.54 | 99.76 | 99.98 | 100.20 | 100.42 | 100.64 | 100.86 |
| Woodie | 96.59 | 97.32 | 99.00 | 99.73 | 101.41 | 102.14 | 103.82 |
| Fibonacci | 97.16 | 98.08 | 98.65 | 99.57 | 100.49 | 101.06 | 101.98 |
| Pivot points | S3 | S2 | S1 | PP | R1 | R2 | R3 |
|---|---|---|---|---|---|---|---|
| Standard | 94.64 | 97.49 | 98.98 | 101.84 | 103.33 | 106.18 | 107.67 |
| Camarilla | 99.28 | 99.67 | 100.07 | 100.47 | 100.87 | 101.27 | 101.67 |
| Woodie | 93.95 | 97.15 | 98.30 | 101.50 | 102.64 | 105.84 | 106.99 |
| Fibonacci | 97.49 | 99.15 | 100.18 | 101.84 | 103.50 | 104.52 | 106.18 |
| Pivot points | S3 | S2 | S1 | PP | R1 | R2 | R3 |
|---|---|---|---|---|---|---|---|
| Standard | 87.12 | 90.27 | 93.75 | 96.91 | 100.39 | 103.54 | 107.02 |
| Camarilla | 95.41 | 96.01 | 96.62 | 97.23 | 97.84 | 98.45 | 99.06 |
| Woodie | 87.28 | 90.35 | 93.91 | 96.99 | 100.55 | 103.62 | 107.18 |
| Fibonacci | 90.27 | 92.81 | 94.37 | 96.91 | 99.44 | 101.01 | 103.54 |
Numerical data
The following is the status of technical indicators and moving averages registered at the time this technical analysis was created:
| RSI (14): | 46.46 | |
| MACD (12,26,9): | 0.6800 | |
| Directional Movement: | -3.45 | |
| AROON (14): | -64.29 | |
| DEMA (21): | 101.55 | |
| Parabolic SAR (0,02-0,02-0,2): | 104.30 | |
| Elder Ray (13): | -1.98 | |
| Super Trend (3,10): | 97.89 | |
| Zig ZAG (10): | 98.79 | |
| VORTEX (21): | 0.9900 | |
| Stochastique (14,3,5): | 19.17 | |
| TEMA (21): | 101.03 | |
| Williams %R (14): | -83.63 | |
| Chande Momentum Oscillator (20): | -4.25 | |
| Repulse (5,40,3): | -0.2100 | |
| ROCnROLL: | -1 | |
| TRIX (15,9): | 0.1800 | |
| Courbe Coppock: | 2.91 |
| MA7: | 100.82 | |
| MA20: | 100.82 | |
| MA50: | 98.51 | |
| MA100: | 93.63 | |
| MAexp7: | 100.35 | |
| MAexp20: | 100.38 | |
| MAexp50: | 98.19 | |
| MAexp100: | 94.93 | |
| Price / MA7: | -2.01% | |
| Price / MA20: | -2.01% | |
| Price / MA50: | +0.28% | |
| Price / MA100: | +5.51% | |
| Price / MAexp7: | -1.55% | |
| Price / MAexp20: | -1.58% | |
| Price / MAexp50: | +0.61% | |
| Price / MAexp100: | +4.07% |
News
The last news published on RELIANCE STEEL & ALUMINUM CO. at the time of the generation of this analysis was as follows:
- Investor Network: RELIANCE STEEL & ALUMINUM CO to Host Earnings Call
- Reliance Steel & Aluminum Co. to Announce Fourth Quarter and Full Year 2016 Results on Thursday, February 16th
- Reliance Steel & Aluminum Co. Announces Participation at Cowen and Company’s Energy and Natural Resources Conference
- Reliance Steel & Aluminum Co. Reports Third Quarter 2016 Financial Results
- Reliance Steel & Aluminum Co. To Announce Third Quarter 2016 Results On Thursday, October 20th
About author

Online


Add a comment
Comments
0 comments on the analysis RELIANCE INC. - Daily