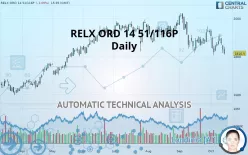
RELX ORD 14 51/116P - Daily - Technical analysis published on 10/14/2019 (GMT)
- 295
- 0
- Who voted?
Click here for a new analysis!
- Timeframe : Daily
- - Analysis generated on
- Status : TARGET REACHED

Summary of the analysis

Additional analysis
Quotes
The RELX ORD 14 51/116P price is 1,816.5 GBX. On the day, this instrument lost -1.09% with the lowest point at 1,809.0 GBX and the highest point at 1,849.5 GBX. The deviation from the price is +0.41% for the low point and -1.78% for the high point.Here is a more detailed summary of the historical variations registered by RELX ORD 14 51/116P:
Near a new LOW record (1 month)
Type : Bearish
Timeframe : Weekly
Technical
Technical analysis of this Daily chart of RELX ORD 14 51/116P indicates that the overall trend is bearish. 71.43% of the signals given by moving averages are bearish. The overall trend is reinforced by the strong bearish signals from short-term moving averages. The Central Indicators market scanner currently does not detect any result that concerns moving averages.
In fact, 12 technical indicators on 18 studied are currently positioned bearish. Caution: the Central Indicators scanner currently detects an excess:
CCI indicator is oversold : under -100
Type : Neutral
Timeframe : Daily
MACD indicator: bearish divergence
Type : Bearish
Timeframe : Daily
Pivot points : price is under support 1
Type : Neutral
Timeframe : Daily
MACD crosses DOWN its Moving Average
Type : Bearish
Timeframe : Daily
Price is back under the pivot point
Type : Bearish
Timeframe : Weekly
The Central Patterns scanner, which studies chart patterns, resistances and supports, has identified these signals:
Near support of channel
Type : Bullish
Timeframe : Daily
Near support of triangle
Type : Bullish
Timeframe : Daily
Horizontal support is broken
Type : Bearish
Timeframe : Daily
For a small setback in the very short term, the Central Candlesticks scanner currently notes the presence of this bearish pattern in Japanese candlesticks:
Downside gap
Type : Bearish
Timeframe : Daily
| S3 | S2 | S1 | Price | R1 | R2 | R3 | |
|---|---|---|---|---|---|---|---|
| ProTrendLines | 1,613.1 | 1,674.8 | 1,782.0 | 1,816.5 | 1,833.0 | 1,867.5 | 1,935.5 |
| Change (%) | -11.20% | -7.80% | -1.90% | - | +0.91% | +2.81% | +6.55% |
| Change | -203.4 | -141.7 | -34.5 | - | +16.5 | +51.0 | +119.0 |
| Level | Intermediate | Minor | Major | - | Major | Major | Intermediate |
Pivot points can also be used to set your price objectives. Here is the price situation in relation to pivot points:
| Pivot points | S3 | S2 | S1 | PP | R1 | R2 | R3 |
|---|---|---|---|---|---|---|---|
| Standard | 1,775.5 | 1,796.5 | 1,816.5 | 1,837.5 | 1,857.5 | 1,878.5 | 1,898.5 |
| Camarilla | 1,825.2 | 1,829.0 | 1,832.7 | 1,836.5 | 1,840.3 | 1,844.0 | 1,847.8 |
| Woodie | 1,775.0 | 1,796.3 | 1,816.0 | 1,837.3 | 1,857.0 | 1,878.3 | 1,898.0 |
| Fibonacci | 1,796.5 | 1,812.2 | 1,821.8 | 1,837.5 | 1,853.2 | 1,862.8 | 1,878.5 |
| Pivot points | S3 | S2 | S1 | PP | R1 | R2 | R3 |
|---|---|---|---|---|---|---|---|
| Standard | 1,708.8 | 1,763.2 | 1,799.8 | 1,854.2 | 1,890.8 | 1,945.2 | 1,981.8 |
| Camarilla | 1,811.5 | 1,819.8 | 1,828.2 | 1,836.5 | 1,844.8 | 1,853.2 | 1,861.5 |
| Woodie | 1,700.0 | 1,758.8 | 1,791.0 | 1,849.8 | 1,882.0 | 1,940.8 | 1,973.0 |
| Fibonacci | 1,763.2 | 1,797.9 | 1,819.4 | 1,854.2 | 1,888.9 | 1,910.4 | 1,945.2 |
| Pivot points | S3 | S2 | S1 | PP | R1 | R2 | R3 |
|---|---|---|---|---|---|---|---|
| Standard | 1,616.5 | 1,717.5 | 1,825.0 | 1,926.0 | 2,033.5 | 2,134.5 | 2,242.0 |
| Camarilla | 1,875.2 | 1,894.3 | 1,913.4 | 1,932.5 | 1,951.6 | 1,970.7 | 1,989.8 |
| Woodie | 1,619.8 | 1,719.1 | 1,828.3 | 1,927.6 | 2,036.8 | 2,136.1 | 2,245.3 |
| Fibonacci | 1,717.5 | 1,797.2 | 1,846.4 | 1,926.0 | 2,005.7 | 2,054.9 | 2,134.5 |
Numerical data
The following is the status of technical indicators and moving averages registered at the time this technical analysis was created:
| RSI (14): | 39.00 | |
| MACD (12,26,9): | -18.2000 | |
| Directional Movement: | -13.4 | |
| AROON (14): | -28.6 | |
| DEMA (21): | 1,852.0 | |
| Parabolic SAR (0,02-0,02-0,2): | 1,937.1 | |
| Elder Ray (13): | -35.5 | |
| Super Trend (3,10): | 1,951.9 | |
| Zig ZAG (10): | 1,816.5 | |
| VORTEX (21): | 0.9000 | |
| Stochastique (14,3,5): | 23.00 | |
| TEMA (21): | 1,842.9 | |
| Williams %R (14): | -93.00 | |
| Chande Momentum Oscillator (20): | -109.0 | |
| Repulse (5,40,3): | -3.1000 | |
| ROCnROLL: | 2 | |
| TRIX (15,9): | -0.1000 | |
| Courbe Coppock: | 3.60 |
| MA7: | 1,858.2 | |
| MA20: | 1,877.8 | |
| MA50: | 1,909.1 | |
| MA100: | 1,906.7 | |
| MAexp7: | 1,852.4 | |
| MAexp20: | 1,874.7 | |
| MAexp50: | 1,892.8 | |
| MAexp100: | 1,870.8 | |
| Price / MA7: | -2.24% | |
| Price / MA20: | -3.26% | |
| Price / MA50: | -4.85% | |
| Price / MA100: | -4.73% | |
| Price / MAexp7: | -1.94% | |
| Price / MAexp20: | -3.10% | |
| Price / MAexp50: | -4.03% | |
| Price / MAexp100: | -2.90% |
About author

Online


Add a comment
Comments
0 comments on the analysis RELX ORD 14 51/116P - Daily