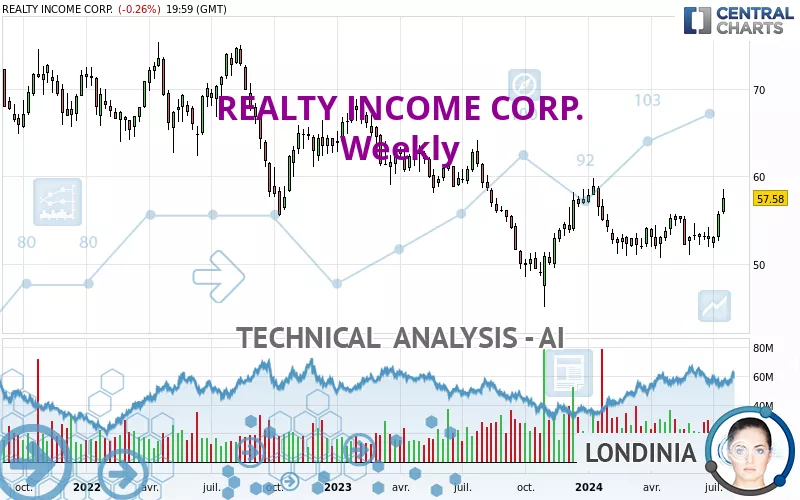
REALTY INCOME CORP. - Weekly - Technical analysis published on 07/20/2024 (GMT)
- 111
- 0
Click here for a new analysis!
- Timeframe : Weekly
- - Analysis generated on
- Status : TARGET REACHED
Summary of the analysis

Additional analysis
Quotes
The REALTY INCOME CORP. rating is 57.58 USD. Over 5 days, this instrument gained +3.28% with the lowest point at 55.85 USD and the highest point at 58.57 USD. The deviation from the price is +3.11% for the low point and -1.69% for the high point.The Central Gaps scanner detects a bearish opening marking the presence of sellers ahead of buyers at the opening but not sufficiently marked to allow the price to register a quotation gap.
Bearish opening
Type : Bearish
Timeframe : Openning
Here is a more detailed summary of the historical variations registered by REALTY INCOME CORP.:
Near a new HIGH record (1st january)
Type : Bullish
Timeframe : Weekly
Near a new HIGH record (1 month)
Type : Bullish
Timeframe : Weekly
Technical
A technical analysis in Weekly of this REALTY INCOME CORP. chart shows a bullish trend. 64.29% of the signals given by moving averages are bullish. This bullish trend is supported by the strong bullish signals given by short-term moving averages. The Central Indicators market scanner is currently detecting several bullish signals that could impact this trend:
Bullish trend reversal : adaptative moving average 50
Type : Bullish
Timeframe : Weekly
Bullish trend reversal : adaptative moving average 100
Type : Bullish
Timeframe : Weekly
Bullish price crossover with adaptative moving average 100
Type : Bullish
Timeframe : Weekly
The probability of a further increase is high given the direction of the technical indicators.
Caution: the Central Indicators scanner currently detects an excess:
CCI indicator is overbought : over 100
Type : Neutral
Timeframe : Weekly
Williams %R indicator is overbought : over -20
Type : Neutral
Timeframe : Weekly
Pivot points : price is over resistance 1
Type : Neutral
Timeframe : Weekly
Ichimoku - Bullish crossover : Tenkan & Kijun
Type : Bullish
Timeframe : Weekly
Central Patterns, the market scanner focusing on chart patterns, resistances and supports found these results:
Near horizontal resistance
Type : Bearish
Timeframe : Weekly
Resistance of channel is broken
Type : Bullish
Timeframe : Weekly
The Central Candlesticks scanner, specialised in Japanese candlesticks, did not identify any signals.
| S3 | S2 | S1 | Price | R1 | R2 | R3 | |
|---|---|---|---|---|---|---|---|
| ProTrendLines | 50.97 | 54.98 | 57.56 | 57.58 | 60.45 | 63.71 | 68.35 |
| Change (%) | -11.48% | -4.52% | -0.03% | - | +4.98% | +10.65% | +18.70% |
| Change | -6.61 | -2.60 | -0.02 | - | +2.87 | +6.13 | +10.77 |
| Level | Major | Major | Major | - | Minor | Intermediate | Major |
Pivot points can also be used to set your price objectives. Here is the price situation in relation to pivot points:
| Pivot points | S3 | S2 | S1 | PP | R1 | R2 | R3 |
|---|---|---|---|---|---|---|---|
| Standard | 56.66 | 56.93 | 57.25 | 57.52 | 57.84 | 58.11 | 58.43 |
| Camarilla | 57.42 | 57.47 | 57.53 | 57.58 | 57.63 | 57.69 | 57.74 |
| Woodie | 56.70 | 56.94 | 57.29 | 57.53 | 57.88 | 58.12 | 58.47 |
| Fibonacci | 56.93 | 57.15 | 57.29 | 57.52 | 57.74 | 57.88 | 58.11 |
| Pivot points | S3 | S2 | S1 | PP | R1 | R2 | R3 |
|---|---|---|---|---|---|---|---|
| Standard | 50.16 | 51.38 | 53.57 | 54.79 | 56.98 | 58.20 | 60.39 |
| Camarilla | 54.81 | 55.13 | 55.44 | 55.75 | 56.06 | 56.38 | 56.69 |
| Woodie | 50.64 | 51.62 | 54.05 | 55.03 | 57.46 | 58.44 | 60.87 |
| Fibonacci | 51.38 | 52.69 | 53.49 | 54.79 | 56.10 | 56.90 | 58.20 |
| Pivot points | S3 | S2 | S1 | PP | R1 | R2 | R3 |
|---|---|---|---|---|---|---|---|
| Standard | 48.54 | 50.07 | 51.31 | 52.84 | 54.08 | 55.61 | 56.85 |
| Camarilla | 51.79 | 52.04 | 52.30 | 52.55 | 52.80 | 53.06 | 53.31 |
| Woodie | 48.40 | 50.00 | 51.17 | 52.77 | 53.94 | 55.54 | 56.71 |
| Fibonacci | 50.07 | 51.13 | 51.78 | 52.84 | 53.90 | 54.55 | 55.61 |
Numerical data
The following is the status of the technical indicators and moving averages at the time of publication of this technical analysis:
| RSI (14): | 65.54 | |
| MACD (12,26,9): | 0.5700 | |
| Directional Movement: | 12.65 | |
| AROON (14): | 92.86 | |
| DEMA (21): | 54.10 | |
| Parabolic SAR (0,02-0,02-0,2): | 51.02 | |
| Elder Ray (13): | 3.19 | |
| Super Trend (3,10): | 50.76 | |
| Zig ZAG (10): | 57.58 | |
| VORTEX (21): | 1.1200 | |
| Stochastique (14,3,5): | 81.56 | |
| TEMA (21): | 54.91 | |
| Williams %R (14): | -11.41 | |
| Chande Momentum Oscillator (20): | 4.67 | |
| Repulse (5,40,3): | 8.4100 | |
| ROCnROLL: | 1 | |
| TRIX (15,9): | 0.0500 | |
| Courbe Coppock: | 7.80 |
| MA7: | 56.58 | |
| MA20: | 54.09 | |
| MA50: | 53.55 | |
| MA100: | 52.79 | |
| MAexp7: | 54.62 | |
| MAexp20: | 53.55 | |
| MAexp50: | 53.72 | |
| MAexp100: | 55.04 | |
| Price / MA7: | +1.77% | |
| Price / MA20: | +6.45% | |
| Price / MA50: | +7.53% | |
| Price / MA100: | +9.07% | |
| Price / MAexp7: | +5.42% | |
| Price / MAexp20: | +7.53% | |
| Price / MAexp50: | +7.19% | |
| Price / MAexp100: | +4.61% |
News
Don't forget to follow the news on REALTY INCOME CORP.. At the time of publication of this analysis, the latest news was as follows:
- Investor Network: Realty Income Corporation to Host Earnings Call
- Realty Income Prices $700 Million Of Multi-Tranche Senior Unsecured Notes
- Realty Income To Redeem All Outstanding Shares Of 6.625% Class F Preferred Stock
- Realty Income Closes 10.85 Million Share Common Stock Offering
- Universal Health Realty Income Trust Reports 2016 Fourth Quarter And Full Year Financial Results
About author

Online


Add a comment
Comments
0 comments on the analysis REALTY INCOME CORP. - Weekly