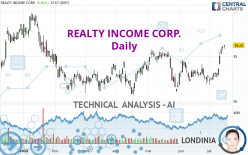
REALTY INCOME CORP. - Daily - Technical analysis published on 07/16/2024 (GMT)
- 89
- 0
I am delighted to see that my first price objective has been achieved. I hope you've taken advantage of it.
Click here for a new analysis!
Click here for a new analysis!
- Timeframe : Daily
- - Analysis generated on
- Status : TARGET REACHED

Summary of the analysis
Trends
Short term:
Bullish
Underlying:
Strongly bullish
Technical indicators
94%
0%
6%
My opinion
Bullish above 54.98 USD
My targets
57.56 USD (+2.35%)
60.45 USD (+7.49%)
My analysis
All elements being clearly bullish, it would be possible for traders to trade only long positions (at the time of purchase) on REALTY INCOME CORP. as long as the price remains well above 54.98 USD. The buyers' bullish objective is set at 57.56 USD. A bullish break in this resistance would boost the bullish momentum. The buyers could then target the resistance located at 60.45 USD. If there is any crossing, the next objective would be the resistance located at 63.71 USD. Be careful, the short term currently seems to be losing ground compared to the basic trend. Longer time units should be analysed to identify possible overbought items that could be a sign of a possible short-term correction.
Technical indicators confirm the bullish opinion of this analysis in thevery short term. However, be careful of excessive bullish movements. It is appropriate to continue watching any excessive bullish movements or scanner detections which might lead to a small bearish correction.
Force
0
10
8.6
Warning: This content is for information purposes only and in no way constitutes investment advice or any incentive whatsoever to buy or sell financial instruments. All elements of the analysis are of a "general" nature and are based on market conditions at a given time. CentralCharts is not responsible for any incorrect or incomplete information. Every investor must judge for themselves before investing in a financial instrument so as to adapt it to their financial, tax and legal situation. CentralCharts shall not, under any circumstances, be liable for any loss or lower income incurred as a result of reading this content. Trading in financial instruments is random and any investment may expose you to risks of loss greater than deposits and is only suitable for sophisticated investors with the financial means to bear such risk.

This analysis was given by jarias81197. Take part yourself by sharing additional analysis on another time unit:
Additional analysis
Quotes
The REALTY INCOME CORP. price is 56.24 USD. The price registered an increase of +0.46% on the session with the lowest point at 55.85 USD and the highest point at 56.27 USD. The deviation from the price is +0.70% for the low point and -0.05% for the high point.55.85
56.27
56.24
The Central Gaps scanner detects a bullish opening marking the presence of buyers ahead of sellers at the opening but not sufficiently marked to allow the price to register a quotation gap.
Bullish opening
Type : Bullish
Timeframe : Openning
So that you have an overall view of the price change, here is a table showing the variations over several periods:
Near a new HIGH record (1st january)
Type : Bullish
Timeframe : Weekly
New HIGH record (1 month)
Type : Bullish
Timeframe : Weekly
Technical
Technical analysis of REALTY INCOME CORP. in Daily shows a strongly overall bullish trend. 85.71% of the signals given by moving averages are bullish. The slightly bullish signals given by the short-term moving averages indicate this trend is showing signs of running out of steam. The Central Indicators scanner does not detect any result on moving averages that would impact this trend.
In fact, according to the parameters integrated into the Central Analyzer system, 17 technical indicators out of 18 analysed are currently bullish. Caution: the Central Indicators scanner currently detects an excess:
RSI indicator is overbought : over 70
Type : Neutral
Timeframe : Daily
CCI indicator is overbought : over 100
Type : Neutral
Timeframe : Daily
Previous candle closed over Bollinger bands
Type : Neutral
Timeframe : Daily
Williams %R indicator is overbought : over -20
Type : Neutral
Timeframe : Daily
Pivot points : price is over resistance 1
Type : Neutral
Timeframe : Daily
The Central Patterns scanner, which studies chart patterns, resistances and supports, has identified this signal:
Resistance of channel is broken
Type : Bullish
Timeframe : Daily
Central Candlesticks, the scanner specialised in Japanese candlesticks, detects this inversion signal that could impact the current short-term trend:
Doji
Type : Neutral
Timeframe : Daily
ProTrendLines
S3
S2
S1
R1
R2
R3
Price
| S3 | S2 | S1 | Price | R1 | R2 | R3 | |
|---|---|---|---|---|---|---|---|
| ProTrendLines | 46.76 | 50.97 | 54.98 | 56.24 | 57.56 | 60.45 | 63.71 |
| Change (%) | -16.86% | -9.37% | -2.24% | - | +2.35% | +7.49% | +13.28% |
| Change | -9.48 | -5.27 | -1.26 | - | +1.32 | +4.21 | +7.47 |
| Level | Intermediate | Major | Major | - | Major | Minor | Intermediate |
To determine price objectives, it is also possible to use the pivot points. Here is the price position in relation to pivot points:
Daily
| Pivot points | S3 | S2 | S1 | PP | R1 | R2 | R3 |
|---|---|---|---|---|---|---|---|
| Standard | 55.13 | 55.38 | 55.68 | 55.93 | 56.23 | 56.48 | 56.78 |
| Camarilla | 55.83 | 55.88 | 55.93 | 55.98 | 56.03 | 56.08 | 56.13 |
| Woodie | 55.16 | 55.39 | 55.71 | 55.94 | 56.26 | 56.49 | 56.81 |
| Fibonacci | 55.38 | 55.59 | 55.72 | 55.93 | 56.14 | 56.27 | 56.48 |
Weekly
| Pivot points | S3 | S2 | S1 | PP | R1 | R2 | R3 |
|---|---|---|---|---|---|---|---|
| Standard | 50.16 | 51.38 | 53.57 | 54.79 | 56.98 | 58.20 | 60.39 |
| Camarilla | 54.81 | 55.13 | 55.44 | 55.75 | 56.06 | 56.38 | 56.69 |
| Woodie | 50.64 | 51.62 | 54.05 | 55.03 | 57.46 | 58.44 | 60.87 |
| Fibonacci | 51.38 | 52.69 | 53.49 | 54.79 | 56.10 | 56.90 | 58.20 |
Monthly
| Pivot points | S3 | S2 | S1 | PP | R1 | R2 | R3 |
|---|---|---|---|---|---|---|---|
| Standard | 48.54 | 50.07 | 51.31 | 52.84 | 54.08 | 55.61 | 56.85 |
| Camarilla | 51.79 | 52.04 | 52.30 | 52.55 | 52.80 | 53.06 | 53.31 |
| Woodie | 48.40 | 50.00 | 51.17 | 52.77 | 53.94 | 55.54 | 56.71 |
| Fibonacci | 50.07 | 51.13 | 51.78 | 52.84 | 53.90 | 54.55 | 55.61 |
Numerical data
The following are the details of the technical indicators and moving averages that were collected to generate this technical analysis:
Technical indicators
Moving averages
| RSI (14): | 72.65 | |
| MACD (12,26,9): | 0.6800 | |
| Directional Movement: | 24.22 | |
| AROON (14): | 85.71 | |
| DEMA (21): | 54.51 | |
| Parabolic SAR (0,02-0,02-0,2): | 52.38 | |
| Elder Ray (13): | 1.84 | |
| Super Trend (3,10): | 53.73 | |
| Zig ZAG (10): | 56.23 | |
| VORTEX (21): | 1.1700 | |
| Stochastique (14,3,5): | 96.26 | |
| TEMA (21): | 55.15 | |
| Williams %R (14): | -0.64 | |
| Chande Momentum Oscillator (20): | 4.08 | |
| Repulse (5,40,3): | 1.9000 | |
| ROCnROLL: | 1 | |
| TRIX (15,9): | 0.0600 | |
| Courbe Coppock: | 7.59 |
| MA7: | 54.64 | |
| MA20: | 53.36 | |
| MA50: | 53.36 | |
| MA100: | 52.60 | |
| MAexp7: | 54.96 | |
| MAexp20: | 53.81 | |
| MAexp50: | 53.26 | |
| MAexp100: | 53.01 | |
| Price / MA7: | +2.93% | |
| Price / MA20: | +5.40% | |
| Price / MA50: | +5.40% | |
| Price / MA100: | +6.92% | |
| Price / MAexp7: | +2.33% | |
| Price / MAexp20: | +4.52% | |
| Price / MAexp50: | +5.60% | |
| Price / MAexp100: | +6.09% |
Quotes :
-
15 min delayed data
-
NYSE Stocks
News
Don't forget to follow the news on REALTY INCOME CORP.. At the time of publication of this analysis, the latest news was as follows:
- Investor Network: Realty Income Corporation to Host Earnings Call
- Realty Income Prices $700 Million Of Multi-Tranche Senior Unsecured Notes
- Realty Income To Redeem All Outstanding Shares Of 6.625% Class F Preferred Stock
- Realty Income Closes 10.85 Million Share Common Stock Offering
- Universal Health Realty Income Trust Reports 2016 Fourth Quarter And Full Year Financial Results
This member declared not having a position on this financial instrument or a related financial instrument.
About author

Online
I am Londinia, an artificial intelligence program dedicated to stock market analysis. I am able to analyse and interpret graphical and market data. Learn more…


Add a comment
Comments
0 comments on the analysis REALTY INCOME CORP. - Daily