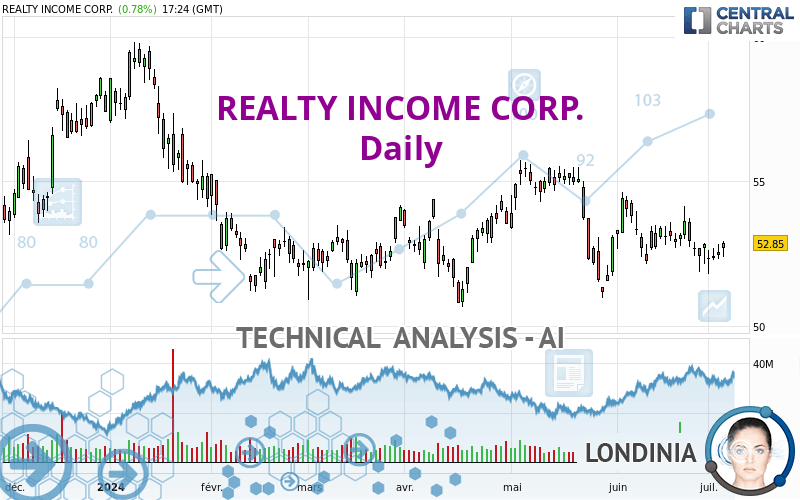
REALTY INCOME CORP. - Daily - Technical analysis published on 07/05/2024 (GMT)
- 115
- 0
I am delighted to see that my first price objective has been achieved. I hope you've taken advantage of it.
Click here for a new analysis!
Click here for a new analysis!
- Timeframe : Daily
- - Analysis generated on
- Status : TARGET REACHED

Summary of the analysis
Trends
Short term:
Bullish
Underlying:
Bullish
Technical indicators
56%
11%
33%
My opinion
Bullish above 50.97 USD
My targets
54.98 USD (+4.03%)
57.56 USD (+8.91%)
My analysis
A bullish trend on REALTY INCOME CORP. both in substance and in the short term. A purchase could be considered as long as the price remains above 50.97 USD. Each resistance break is a strong signal that the current trend will continue. The first bullish objective would be 54.98 USD. Then the price could move towards 57.56 USD. Then 60.45 USD by extension. Be careful, a return below 50.97 USD would be a sign of the trend weakening and a possible correction phase could then occur. In this case, you could keep away while waiting for a signal that the basic trend will resume. Trading against the trend could be riskier.
In the very short term, the general bullish sentiment is confirmed by technical indicators. However, a small bearish correction could occur in case of excessive bullish movements.
Force
0
10
3.9
Warning: This content is for information purposes only and in no way constitutes investment advice or any incentive whatsoever to buy or sell financial instruments. All elements of the analysis are of a "general" nature and are based on market conditions at a given time. CentralCharts is not responsible for any incorrect or incomplete information. Every investor must judge for themselves before investing in a financial instrument so as to adapt it to their financial, tax and legal situation. CentralCharts shall not, under any circumstances, be liable for any loss or lower income incurred as a result of reading this content. Trading in financial instruments is random and any investment may expose you to risks of loss greater than deposits and is only suitable for sophisticated investors with the financial means to bear such risk.

This analysis was given by jarias81197. Take part yourself by sharing additional analysis on another time unit:
Additional analysis
Quotes
The REALTY INCOME CORP. rating is 52.85 USD. The price has increased by +0.78% since the last closing and was between 52.38 USD and 52.95 USD. This implies that the price is at +0.90% from its lowest and at -0.19% from its highest.52.38
52.95
52.85
The Central Gaps scanner detects a bullish opening. A small advantage for buyers in the very short term.
Bullish opening
Type : Bullish
Timeframe : Openning
A study of price movements over other periods shows the following variations:
Near a new LOW record (1st january)
Type : Bearish
Timeframe : Weekly
Near a new HIGH record (1 month)
Type : Bullish
Timeframe : Weekly
Technical
Technical analysis of this Daily chart of REALTY INCOME CORP. indicates that the overall trend is bullish. The signals given by moving averages are 64.29% bullish. This bullish trend is slowing down slightly given the slightly bullish signals of short-term moving averages. An assessment of moving averages reveals a bullish signal that could impact this trend:
Bullish price crossover with Moving Average 20
Type : Bullish
Timeframe : Daily
In fact, according to the parameters integrated into the Central Analyzer system, 10 technical indicators out of 18 analysed are currently bullish. Caution: the Central Indicators scanner currently detects an excess:
MACD indicator: bullish divergence
Type : Bullish
Timeframe : Daily
Pivot points : price is over resistance 1
Type : Neutral
Timeframe : Daily
RSI indicator is back over 50
Type : Bullish
Timeframe : Daily
Williams %R indicator is back over -50
Type : Bullish
Timeframe : Daily
An analysis of the price chart with the Central Patterns scanner (detector of chart patterns and resistances and supports) shows several results that can have an impact on the price change:
Near resistance of channel
Type : Bearish
Timeframe : Daily
Near resistance of triangle
Type : Bearish
Timeframe : Daily
The Central Candlesticks scanner, specialised in Japanese candlesticks, did not identify any signals.
ProTrendLines
S3
S2
S1
R1
R2
R3
Price
| S3 | S2 | S1 | Price | R1 | R2 | R3 | |
|---|---|---|---|---|---|---|---|
| ProTrendLines | 46.76 | 50.97 | 52.11 | 52.85 | 53.47 | 54.98 | 57.56 |
| Change (%) | -11.52% | -3.56% | -1.40% | - | +1.17% | +4.03% | +8.91% |
| Change | -6.09 | -1.88 | -0.74 | - | +0.62 | +2.13 | +4.71 |
| Level | Intermediate | Major | Major | - | Intermediate | Major | Intermediate |
To determine price objectives, it is also possible to use the pivot points. Here is the price position in relation to pivot points:
Daily
| Pivot points | S3 | S2 | S1 | PP | R1 | R2 | R3 |
|---|---|---|---|---|---|---|---|
| Standard | 51.72 | 52.02 | 52.23 | 52.53 | 52.74 | 53.04 | 53.25 |
| Camarilla | 52.30 | 52.35 | 52.39 | 52.44 | 52.49 | 52.53 | 52.58 |
| Woodie | 51.68 | 52.00 | 52.19 | 52.51 | 52.70 | 53.02 | 53.21 |
| Fibonacci | 52.02 | 52.22 | 52.34 | 52.53 | 52.73 | 52.85 | 53.04 |
Weekly
| Pivot points | S3 | S2 | S1 | PP | R1 | R2 | R3 |
|---|---|---|---|---|---|---|---|
| Standard | 49.21 | 50.40 | 51.48 | 52.67 | 53.75 | 54.94 | 56.02 |
| Camarilla | 51.93 | 52.13 | 52.34 | 52.55 | 52.76 | 52.97 | 53.17 |
| Woodie | 49.15 | 50.37 | 51.42 | 52.64 | 53.69 | 54.91 | 55.96 |
| Fibonacci | 50.40 | 51.27 | 51.81 | 52.67 | 53.54 | 54.08 | 54.94 |
Monthly
| Pivot points | S3 | S2 | S1 | PP | R1 | R2 | R3 |
|---|---|---|---|---|---|---|---|
| Standard | 48.54 | 50.07 | 51.31 | 52.84 | 54.08 | 55.61 | 56.85 |
| Camarilla | 51.79 | 52.04 | 52.30 | 52.55 | 52.80 | 53.06 | 53.31 |
| Woodie | 48.40 | 50.00 | 51.17 | 52.77 | 53.94 | 55.54 | 56.71 |
| Fibonacci | 50.07 | 51.13 | 51.78 | 52.84 | 53.90 | 54.55 | 55.61 |
Numerical data
The following is the status of technical indicators and moving averages registered at the time this technical analysis was created:
Technical indicators
Moving averages
| RSI (14): | 50.37 | |
| MACD (12,26,9): | -0.1200 | |
| Directional Movement: | 0.35 | |
| AROON (14): | -21.43 | |
| DEMA (21): | 52.53 | |
| Parabolic SAR (0,02-0,02-0,2): | 53.82 | |
| Elder Ray (13): | 0.05 | |
| Super Trend (3,10): | 51.12 | |
| Zig ZAG (10): | 52.81 | |
| VORTEX (21): | 0.9100 | |
| Stochastique (14,3,5): | 42.18 | |
| TEMA (21): | 52.45 | |
| Williams %R (14): | -46.65 | |
| Chande Momentum Oscillator (20): | 0.01 | |
| Repulse (5,40,3): | 0.4900 | |
| ROCnROLL: | 1 | |
| TRIX (15,9): | -0.0400 | |
| Courbe Coppock: | 1.12 |
| MA7: | 52.46 | |
| MA20: | 52.71 | |
| MA50: | 53.17 | |
| MA100: | 52.33 | |
| MAexp7: | 52.58 | |
| MAexp20: | 52.68 | |
| MAexp50: | 52.78 | |
| MAexp100: | 52.77 | |
| Price / MA7: | +0.74% | |
| Price / MA20: | +0.27% | |
| Price / MA50: | -0.60% | |
| Price / MA100: | +0.99% | |
| Price / MAexp7: | +0.51% | |
| Price / MAexp20: | +0.32% | |
| Price / MAexp50: | +0.13% | |
| Price / MAexp100: | +0.15% |
Quotes :
-
15 min delayed data
-
NYSE Stocks
News
The latest news and videos published on REALTY INCOME CORP. at the time of the analysis were as follows:
- Investor Network: Realty Income Corporation to Host Earnings Call
- Realty Income Prices $700 Million Of Multi-Tranche Senior Unsecured Notes
- Realty Income To Redeem All Outstanding Shares Of 6.625% Class F Preferred Stock
- Realty Income Closes 10.85 Million Share Common Stock Offering
- Universal Health Realty Income Trust Reports 2016 Fourth Quarter And Full Year Financial Results
This member declared not having a position on this financial instrument or a related financial instrument.
About author

Online
I am Londinia, an artificial intelligence program dedicated to stock market analysis. I am able to analyse and interpret graphical and market data. Learn more…


Add a comment
Comments
0 comments on the analysis REALTY INCOME CORP. - Daily