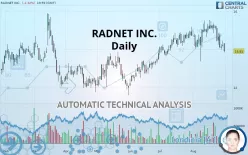
RADNET INC. - Daily - Technical analysis published on 09/02/2019 (GMT)
- 168
- 0
- Who voted?
Click here for a new analysis!
- Timeframe : Daily
- - Analysis generated on
- Status : INVALID

Summary of the analysis

Additional analysis
Quotes
RADNET INC. rating 13.91 USD. The price is lower by -2.32% since the last closing and was traded between 13.85 USD and 14.31 USD over the period. The price is currently at +0.43% from its lowest and -2.80% from its highest.The Central Gaps scanner detects a bullish opening marking the presence of buyers ahead of sellers at the opening but not sufficiently marked to allow the price to register a quotation gap.
Bullish opening
Type : Bullish
Timeframe : Openning
A study of price movements over other periods shows the following variations:
Near a new LOW record (1 month)
Type : Bearish
Timeframe : Weekly
Technical
Technical analysis of this Daily chart of RADNET INC. indicates that the overall trend is not clearly defined. The trend could quickly turn bearish due to the strong bearish signals currently being given by short-term moving averages. There is no crossing of moving average by the price or crossing of moving averages between themselves.
An assessment of technical indicators does not currently provide any relevant information to suggest whether the signal given by the technical indicators is more bullish or bearish.
Caution: the Central Indicators scanner currently detects an excess:
CCI indicator: bullish divergence
Type : Bullish
Timeframe : Daily
Williams %R indicator is oversold : under -80
Type : Neutral
Timeframe : Daily
Pivot points : price is under support 1
Type : Neutral
Timeframe : Weekly
Pivot points : price is under support 3
Type : Neutral
Timeframe : Daily
Ichimoku : price is over the cloud
Type : Bullish
Timeframe : Daily
MACD indicator is back under 0
Type : Bearish
Timeframe : Daily
Central Patterns, the market scanner focusing on chart patterns, resistances and supports found this result:
Support of channel is broken
Type : Bearish
Timeframe : Daily
The Central Candlesticks scanner, specialised in Japanese candlesticks, did not identify any signals.
| S3 | S2 | S1 | Price | R1 | R2 | R3 | |
|---|---|---|---|---|---|---|---|
| ProTrendLines | 12.08 | 13.13 | 13.62 | 13.91 | 14.14 | 14.70 | 15.23 |
| Change (%) | -13.16% | -5.61% | -2.08% | - | +1.65% | +5.68% | +9.49% |
| Change | -1.83 | -0.78 | -0.29 | - | +0.23 | +0.79 | +1.32 |
| Level | Major | Minor | Intermediate | - | Major | Minor | Minor |
To determine price objectives, it is also possible to use the pivot points. Here is the price position in relation to pivot points:
| Pivot points | S3 | S2 | S1 | PP | R1 | R2 | R3 |
|---|---|---|---|---|---|---|---|
| Standard | 13.78 | 13.97 | 14.10 | 14.29 | 14.42 | 14.61 | 14.74 |
| Camarilla | 14.15 | 14.18 | 14.21 | 14.24 | 14.27 | 14.30 | 14.33 |
| Woodie | 13.76 | 13.96 | 14.08 | 14.28 | 14.40 | 14.60 | 14.72 |
| Fibonacci | 13.97 | 14.09 | 14.16 | 14.29 | 14.41 | 14.48 | 14.61 |
| Pivot points | S3 | S2 | S1 | PP | R1 | R2 | R3 |
|---|---|---|---|---|---|---|---|
| Standard | 13.03 | 13.72 | 14.10 | 14.79 | 15.17 | 15.86 | 16.24 |
| Camarilla | 14.18 | 14.27 | 14.37 | 14.47 | 14.57 | 14.67 | 14.76 |
| Woodie | 12.87 | 13.64 | 13.94 | 14.71 | 15.01 | 15.78 | 16.08 |
| Fibonacci | 13.72 | 14.13 | 14.39 | 14.79 | 15.20 | 15.46 | 15.86 |
| Pivot points | S3 | S2 | S1 | PP | R1 | R2 | R3 |
|---|---|---|---|---|---|---|---|
| Standard | 12.27 | 12.95 | 13.84 | 14.52 | 15.41 | 16.09 | 16.98 |
| Camarilla | 14.30 | 14.44 | 14.59 | 14.73 | 14.87 | 15.02 | 15.16 |
| Woodie | 12.38 | 13.00 | 13.95 | 14.57 | 15.52 | 16.14 | 17.09 |
| Fibonacci | 12.95 | 13.55 | 13.92 | 14.52 | 15.12 | 15.49 | 16.09 |
Numerical data
The following is the status of the technical indicators and moving averages at the time of publication of this technical analysis:
| RSI (14): | 38.16 | |
| MACD (12,26,9): | -0.0600 | |
| Directional Movement: | -11.87 | |
| AROON (14): | -71.43 | |
| DEMA (21): | 14.57 | |
| Parabolic SAR (0,02-0,02-0,2): | 15.29 | |
| Elder Ray (13): | -0.43 | |
| Super Trend (3,10): | 13.85 | |
| Zig ZAG (10): | 13.91 | |
| VORTEX (21): | 0.9200 | |
| Stochastique (14,3,5): | 8.66 | |
| TEMA (21): | 14.30 | |
| Williams %R (14): | -96.47 | |
| Chande Momentum Oscillator (20): | -1.13 | |
| Repulse (5,40,3): | -6.5300 | |
| ROCnROLL: | 2 | |
| TRIX (15,9): | 0.1000 | |
| Courbe Coppock: | 5.28 |
| MA7: | 14.37 | |
| MA20: | 14.70 | |
| MA50: | 14.41 | |
| MA100: | 13.59 | |
| MAexp7: | 14.32 | |
| MAexp20: | 14.57 | |
| MAexp50: | 14.33 | |
| MAexp100: | 13.93 | |
| Price / MA7: | -3.20% | |
| Price / MA20: | -5.37% | |
| Price / MA50: | -3.47% | |
| Price / MA100: | +2.35% | |
| Price / MAexp7: | -2.86% | |
| Price / MAexp20: | -4.53% | |
| Price / MAexp50: | -2.93% | |
| Price / MAexp100: | -0.14% |
News
The latest news and videos published on RADNET INC. at the time of the analysis were as follows:
- MemorialCare & RadNet Add More Accessible Medical Imaging Centers
- RadNet, Inc. to Host Earnings Call
- Investor Network: RadNet, Inc. to Host Earnings Call
- RadNet, Inc. Acquires Equity Stake in Medic Vision
- Investor Network: RadNet, Inc. to Host Earnings Call
About author

Online


Add a comment
Comments
0 comments on the analysis RADNET INC. - Daily