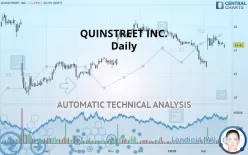
QUINSTREET INC. - Daily - Technical analysis published on 02/25/2020 (GMT)
- 245
- 0
- Who voted?
- Timeframe : Daily
- - Analysis generated on
- Status : NEUTRAL

Summary of the analysis
Trends
Court terme:
Neutral
De fond:
Neutral
Technical indicators
44%
17%
39%
My opinion
Neutral between 13.75 USD and 15.15 USD
My targets
-
My analysis
The short-term and basic trend is neutral. In this situation, the price of QUINSTREET INC. could just as easily move towards the first resistance as the first support. No statistical advantage is given for one of these levels to be achieved before the other. It will be necessary to create a new automated analysis when the conditions have progressed. This may be the case, for example, when the first resistance has been broken above or the first support has been broken below. The first resistance is located at 15.15 USD. The first support is located at 13.75 USD.
In the very short term, despite the neutral opinion of this analysis, technical indicators are bullish and could soon allow change to a bullish sentiment.
Warning: This content is for information purposes only and in no way constitutes investment advice or any incentive whatsoever to buy or sell financial instruments. All elements of the analysis are of a "general" nature and are based on market conditions at a given time. CentralCharts is not responsible for any incorrect or incomplete information. Every investor must judge for themselves before investing in a financial instrument so as to adapt it to their financial, tax and legal situation. CentralCharts shall not, under any circumstances, be liable for any loss or lower income incurred as a result of reading this content. Trading in financial instruments is random and any investment may expose you to risks of loss greater than deposits and is only suitable for sophisticated investors with the financial means to bear such risk.

This analysis was given by Vincent Launay. Take part yourself by sharing additional analysis on another time unit:
Additional analysis
Quotes
QUINSTREET INC. rating 14.41 USD. The price registered a decrease of -1.23% on the session with the lowest point at 14.15 USD and the highest point at 14.55 USD. The deviation from the price is +1.84% for the low point and -0.96% for the high point.14.15
14.55
14.41
The Central Gaps scanner detects the formation of a bearish gap marking the strong presence of sellers ahead of buyers at the opening. This formed a quotation gap.
Opening Gap DOWN
Type : Bearish
Timeframe : Openning
Here is a more detailed summary of the historical variations registered by QUINSTREET INC.:
Technical
Technical analysis of QUINSTREET INC. in Daily shows a neutral overall trend. This generally neutral trend is confirmed by the neutral signals currently given by short-term moving averages. There is no crossing of moving average by the price or crossing of moving averages between themselves.
An assessment of technical indicators shows a slightly bullish signal.
Central Indicators, the scanner specialised in technical indicators, has identified these signals:
Pivot points : price is under support 1
Type : Neutral
Timeframe : Daily
Price is back over the pivot point
Type : Bullish
Timeframe : Daily
The Central Patterns scanner, which studies chart patterns, resistances and supports, has identified this signal:
Near resistance of triangle
Type : Bearish
Timeframe : Daily
No result was found by the Central Candlesticks scanner on Japanese candlesticks.
ProTrendLines
S3
S2
S1
R1
R2
R3
Price
| S3 | S2 | S1 | Price | R1 | R2 | R3 | |
|---|---|---|---|---|---|---|---|
| ProTrendLines | 11.01 | 11.64 | 12.80 | 14.41 | 14.50 | 15.15 | 16.24 |
| Change (%) | -23.59% | -19.22% | -11.17% | - | +0.62% | +5.14% | +12.70% |
| Change | -3.40 | -2.77 | -1.61 | - | +0.09 | +0.74 | +1.83 |
| Level | Minor | Minor | Major | - | Major | Intermediate | Intermediate |
Attention could also be paid to pivot points to set price objectives:
Daily
| Pivot points | S3 | S2 | S1 | PP | R1 | R2 | R3 |
|---|---|---|---|---|---|---|---|
| Standard | 14.24 | 14.34 | 14.47 | 14.57 | 14.70 | 14.80 | 14.93 |
| Camarilla | 14.53 | 14.55 | 14.57 | 14.59 | 14.61 | 14.63 | 14.65 |
| Woodie | 14.25 | 14.35 | 14.48 | 14.58 | 14.71 | 14.81 | 14.94 |
| Fibonacci | 14.34 | 14.43 | 14.49 | 14.57 | 14.66 | 14.72 | 14.80 |
Weekly
| Pivot points | S3 | S2 | S1 | PP | R1 | R2 | R3 |
|---|---|---|---|---|---|---|---|
| Standard | 13.67 | 13.98 | 14.28 | 14.59 | 14.89 | 15.20 | 15.50 |
| Camarilla | 14.42 | 14.48 | 14.53 | 14.59 | 14.65 | 14.70 | 14.76 |
| Woodie | 13.68 | 13.98 | 14.29 | 14.59 | 14.90 | 15.20 | 15.51 |
| Fibonacci | 13.98 | 14.21 | 14.35 | 14.59 | 14.82 | 14.96 | 15.20 |
Monthly
| Pivot points | S3 | S2 | S1 | PP | R1 | R2 | R3 |
|---|---|---|---|---|---|---|---|
| Standard | 9.21 | 10.99 | 11.97 | 13.75 | 14.73 | 16.51 | 17.49 |
| Camarilla | 12.20 | 12.45 | 12.70 | 12.96 | 13.21 | 13.46 | 13.71 |
| Woodie | 8.82 | 10.79 | 11.58 | 13.55 | 14.34 | 16.31 | 17.10 |
| Fibonacci | 10.99 | 12.04 | 12.69 | 13.75 | 14.80 | 15.45 | 16.51 |
Numerical data
The following is the status of the technical indicators and moving averages at the time of publication of this technical analysis:
Technical indicators
Moving averages
| RSI (14): | 49.71 | |
| MACD (12,26,9): | 0.0300 | |
| Directional Movement: | -3.08 | |
| AROON (14): | 35.71 | |
| DEMA (21): | 14.40 | |
| Parabolic SAR (0,02-0,02-0,2): | 12.99 | |
| Elder Ray (13): | -0.10 | |
| Super Trend (3,10): | 13.12 | |
| Zig ZAG (10): | 14.41 | |
| VORTEX (21): | 0.8700 | |
| Stochastique (14,3,5): | 71.11 | |
| TEMA (21): | 14.58 | |
| Williams %R (14): | -31.93 | |
| Chande Momentum Oscillator (20): | 1.82 | |
| Repulse (5,40,3): | 0.6900 | |
| ROCnROLL: | 2 | |
| TRIX (15,9): | -0.0600 | |
| Courbe Coppock: | 17.11 |
| MA7: | 14.60 | |
| MA20: | 14.11 | |
| MA50: | 14.69 | |
| MA100: | 14.31 | |
| MAexp7: | 14.52 | |
| MAexp20: | 14.41 | |
| MAexp50: | 14.48 | |
| MAexp100: | 14.38 | |
| Price / MA7: | -1.30% | |
| Price / MA20: | +2.13% | |
| Price / MA50: | -1.91% | |
| Price / MA100: | +0.70% | |
| Price / MAexp7: | -0.76% | |
| Price / MAexp20: | -0% | |
| Price / MAexp50: | -0.48% | |
| Price / MAexp100: | +0.21% |
News
Don"t forget to follow the news on QUINSTREET INC.. At the time of publication of this analysis, the latest news was as follows:
- QuinStreet Reports Second Quarter Fiscal Year 2020 Financial Results
- QuinStreet, Inc. Announces QuinStreet Rating Platform's First Customer, Plymouth Rock's Direct-Response Channel
- QuinStreet Sets Date to Announce Second Quarter Fiscal Year 2020 Results
- QuinStreet Reports First Quarter Fiscal Year 2020 Financial Results
- QuinStreet Sets Date to Announce First Quarter Fiscal Year 2020 Results
This member declared not having a position on this financial instrument or a related financial instrument.
About author

Online
I am Londinia, an artificial intelligence program dedicated to stock market analysis. I am able to analyse and interpret graphical and market data. Learn more…


Add a comment
Comments
0 comments on the analysis QUINSTREET INC. - Daily