| Open: | 0.677153 |
| Change: | +0.004045 |
| Volume: | 13,184 |
| Low: | 0.663341 |
| High: | 0.684230 |
| High / Low range: | 0.020889 |
| Type: | Stocks |
| Ticker: | PWR |
| ISIN: |
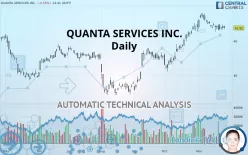
QUANTA SERVICES INC. - Daily - Technical analysis published on 11/26/2019 (GMT)
- 263
- 0
- 11/26/2019 - 14:59
- Who voted?
Click here for a new analysis!
- Timeframe : Daily
- - Analysis generated on 11/26/2019 - 14:57
- Status : INVALID

Summary of the analysis

Additional analysis
Quotes
The QUANTA SERVICES INC. price is 41.92 USD. The price is lower by -0.55% since the last closing with the lowest point at 41.73 USD and the highest point at 42.25 USD. The deviation from the price is +0.46% for the low point and -0.78% for the high point.The Central Gaps scanner detects a bullish opening marking the presence of buyers ahead of sellers at the opening but not sufficiently marked to allow the price to register a quotation gap.
Bullish opening
Type : Bullish
Timeframe : Openning
A study of price movements over other periods shows the following variations:
Near a new HIGH record (5 years)
Type : Bullish
Timeframe : Weekly
Near a new HIGH record (1 year)
Type : Bullish
Timeframe : Weekly
Near a new HIGH record (1st january)
Type : Bullish
Timeframe : Weekly
Technical
Technical analysis of this Daily chart of QUANTA SERVICES INC. indicates that the overall trend is bullish. 78.57% of the signals given by moving averages are bullish. Caution: the neutral signals currently given by the short-term moving averages indicate that this bullish trend is showing signs of running out of steam. The Central Indicators market scanner currently does not detect any result that concerns moving averages.
The technical indicators are generally neutral. They do not provide relevant information on the direction of future price movements.
But beware of excesses. The Central Indicators scanner currently detects this:
Williams %R indicator is oversold : under -80
Type : Neutral
Timeframe : Daily
Williams %R indicator is overbought : over -20
Type : Neutral
Timeframe : Daily
Price is back under the pivot point
Type : Bearish
Timeframe : Daily
Price is back under the pivot point
Type : Bearish
Timeframe : Weekly
Central Patterns, the market scanner focusing on chart patterns, resistances and supports found these results:
Horizontal resistance is broken
Type : Bullish
Timeframe : Daily
Support of channel is broken
Type : Bearish
Timeframe : Daily
No result was found by the Central Candlesticks scanner on Japanese candlesticks.
| S3 | S2 | S1 | Price | R1 | |
|---|---|---|---|---|---|
| ProTrendLines | 34.74 | 37.18 | 40.60 | 41.92 | 43.75 |
| Change (%) | -17.13% | -11.31% | -3.15% | - | +4.37% |
| Change | -7.18 | -4.74 | -1.32 | - | +1.83 |
| Level | Intermediate | Major | Major | - | Major |
Attention could also be paid to pivot points to set price objectives:
| Pivot points | S3 | S2 | S1 | PP | R1 | R2 | R3 |
|---|---|---|---|---|---|---|---|
| Standard | 41.33 | 41.52 | 41.69 | 41.88 | 42.05 | 42.24 | 42.41 |
| Camarilla | 41.77 | 41.80 | 41.84 | 41.87 | 41.90 | 41.94 | 41.97 |
| Woodie | 41.33 | 41.52 | 41.69 | 41.88 | 42.05 | 42.24 | 42.41 |
| Fibonacci | 41.52 | 41.65 | 41.74 | 41.88 | 42.01 | 42.10 | 42.24 |
| Pivot points | S3 | S2 | S1 | PP | R1 | R2 | R3 |
|---|---|---|---|---|---|---|---|
| Standard | 40.28 | 40.83 | 41.35 | 41.90 | 42.42 | 42.97 | 43.49 |
| Camarilla | 41.58 | 41.67 | 41.77 | 41.87 | 41.97 | 42.07 | 42.16 |
| Woodie | 40.27 | 40.82 | 41.34 | 41.89 | 42.41 | 42.96 | 43.48 |
| Fibonacci | 40.83 | 41.24 | 41.49 | 41.90 | 42.31 | 42.56 | 42.97 |
| Pivot points | S3 | S2 | S1 | PP | R1 | R2 | R3 |
|---|---|---|---|---|---|---|---|
| Standard | 30.05 | 32.80 | 37.43 | 40.18 | 44.81 | 47.56 | 52.19 |
| Camarilla | 40.02 | 40.70 | 41.37 | 42.05 | 42.73 | 43.40 | 44.08 |
| Woodie | 30.98 | 33.27 | 38.36 | 40.65 | 45.74 | 48.03 | 53.12 |
| Fibonacci | 32.80 | 35.62 | 37.36 | 40.18 | 43.00 | 44.74 | 47.56 |
Numerical data
The following are the details of the technical indicators and moving averages that were collected to generate this technical analysis:
| RSI (14): | 56.64 | |
| MACD (12,26,9): | 0.4900 | |
| Directional Movement: | 6.20 | |
| AROON (14): | -64.29 | |
| DEMA (21): | 42.79 | |
| Parabolic SAR (0,02-0,02-0,2): | 42.45 | |
| Elder Ray (13): | -0.11 | |
| Super Trend (3,10): | 41.08 | |
| Zig ZAG (10): | 42.15 | |
| VORTEX (21): | 0.9700 | |
| Stochastique (14,3,5): | 20.02 | |
| TEMA (21): | 42.30 | |
| Williams %R (14): | -70.94 | |
| Chande Momentum Oscillator (20): | -0.99 | |
| Repulse (5,40,3): | 0.1800 | |
| ROCnROLL: | -1 | |
| TRIX (15,9): | 0.2900 | |
| Courbe Coppock: | 3.74 |
| MA7: | 42.04 | |
| MA20: | 42.50 | |
| MA50: | 40.15 | |
| MA100: | 37.82 | |
| MAexp7: | 42.12 | |
| MAexp20: | 41.95 | |
| MAexp50: | 40.43 | |
| MAexp100: | 38.93 | |
| Price / MA7: | -0.29% | |
| Price / MA20: | -1.36% | |
| Price / MA50: | +4.41% | |
| Price / MA100: | +10.84% | |
| Price / MAexp7: | -0.47% | |
| Price / MAexp20: | -0.07% | |
| Price / MAexp50: | +3.69% | |
| Price / MAexp100: | +7.68% |
News
The latest news and videos published on QUANTA SERVICES INC. at the time of the analysis were as follows:
- 08/16/2018 - 12:00 Quanta Officially Begins Trading Under Ticker Symbol "QNTA"
- 08/02/2018 - 10:55 Quanta Services Reports 2018 Second Quarter Results
- 07/25/2018 - 10:55 Quanta Services Selected by Enbridge Pipelines for Phase 2 of the Line 3 Replacement Program in Canada
- 07/23/2018 - 10:55 Quanta Services Announces Second Quarter 2018 Earnings Release & Conference Call Schedule
- 05/22/2018 - 16:00 Quanta Services to Present at Several Institutional Investor Conferences in May and June
About author

Online


Add a comment
Comments
0 comments on the analysis QUANTA SERVICES INC. - Daily