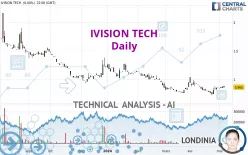
IVISION TECH - Daily - Technical analysis published on 05/08/2024 (GMT)
- 126
- 0
Click here for a new analysis!
- Timeframe : Daily
- - Analysis generated on
- Status : TARGET REACHED

Summary of the analysis

Additional analysis
Quotes
IVISION TECH rating 0.970 EUR. The price has increased by +12.14% since the last closing with the lowest point at 0.885 EUR and the highest point at 0.970 EUR. The deviation from the price is +9.60% for the low point and 0% for the high point.Here is a more detailed summary of the historical variations registered by IVISION TECH:
Technical
A technical analysis in Daily of this IVISION TECH chart shows a slightly bearish trend. 57.14% of the signals given by moving averages are bearish. Caution: the strong bullish signals currently being given by short-term moving averages indicate that this slightly bearish trend could quickly be reversed. The Central Indicators market scanner is currently detecting several bullish signals that could impact this trend:
Bullish price crossover with Moving Average 50
Type : Bullish
Timeframe : Daily
Bullish price crossover with adaptative moving average 50
Type : Bullish
Timeframe : Daily
Bullish price crossover with adaptative moving average 100
Type : Bullish
Timeframe : Daily
The probability of a further increase is high given the direction of the technical indicators.
Caution: the Central Indicators scanner currently detects an excess:
CCI indicator is overbought : over 100
Type : Neutral
Timeframe : Daily
Williams %R indicator is overbought : over -20
Type : Neutral
Timeframe : Daily
Pivot points : price is over resistance 2
Type : Neutral
Timeframe : Weekly
Pivot points : price is over resistance 3
Type : Neutral
Timeframe : Daily
SuperTrend indicator bullish reversal
Type : Bullish
Timeframe : Daily
MACD indicator is back over 0
Type : Bullish
Timeframe : Daily
Central Patterns, the scanner specializing in chart patterns, did not identify any signals.
No result was found by the Central Candlesticks scanner on Japanese candlesticks.
| S2 | S1 | Price | R1 | R2 | R3 | |
|---|---|---|---|---|---|---|
| ProTrendLines | 0.740 | 0.950 | 0.970 | 1.275 | 1.435 | 1.790 |
| Change (%) | -23.71% | -2.06% | - | +31.44% | +47.94% | +84.54% |
| Change | -0.230 | -0.020 | - | +0.305 | +0.465 | +0.820 |
| Level | Intermediate | Intermediate | - | Minor | Minor | Minor |
Attention could also be paid to pivot points to set price objectives:
| Pivot points | S3 | S2 | S1 | PP | R1 | R2 | R3 |
|---|---|---|---|---|---|---|---|
| Standard | 0.807 | 0.828 | 0.847 | 0.868 | 0.887 | 0.908 | 0.927 |
| Camarilla | 0.854 | 0.858 | 0.861 | 0.865 | 0.869 | 0.872 | 0.876 |
| Woodie | 0.805 | 0.828 | 0.845 | 0.868 | 0.885 | 0.908 | 0.925 |
| Fibonacci | 0.828 | 0.844 | 0.853 | 0.868 | 0.884 | 0.893 | 0.908 |
| Pivot points | S3 | S2 | S1 | PP | R1 | R2 | R3 |
|---|---|---|---|---|---|---|---|
| Standard | 0.807 | 0.823 | 0.837 | 0.853 | 0.867 | 0.883 | 0.897 |
| Camarilla | 0.842 | 0.845 | 0.847 | 0.850 | 0.853 | 0.856 | 0.858 |
| Woodie | 0.805 | 0.823 | 0.835 | 0.853 | 0.865 | 0.883 | 0.895 |
| Fibonacci | 0.823 | 0.835 | 0.842 | 0.853 | 0.865 | 0.872 | 0.883 |
| Pivot points | S3 | S2 | S1 | PP | R1 | R2 | R3 |
|---|---|---|---|---|---|---|---|
| Standard | 0.395 | 0.560 | 0.710 | 0.875 | 1.025 | 1.190 | 1.340 |
| Camarilla | 0.773 | 0.802 | 0.831 | 0.860 | 0.889 | 0.918 | 0.947 |
| Woodie | 0.388 | 0.556 | 0.703 | 0.871 | 1.018 | 1.186 | 1.333 |
| Fibonacci | 0.560 | 0.680 | 0.755 | 0.875 | 0.995 | 1.070 | 1.190 |
Numerical data
The following are the details of the technical indicators and moving averages that were collected to generate this technical analysis:
| RSI (14): | 65.50 | |
| MACD (12,26,9): | 0.0020 | |
| Directional Movement: | 20.049 | |
| AROON (14): | 64.286 | |
| DEMA (21): | 0.853 | |
| Parabolic SAR (0,02-0,02-0,2): | 0.754 | |
| Elder Ray (13): | 0.066 | |
| Super Trend (3,10): | 0.789 | |
| Zig ZAG (10): | 0.970 | |
| VORTEX (21): | 0.9490 | |
| Stochastique (14,3,5): | 91.82 | |
| TEMA (21): | 0.881 | |
| Williams %R (14): | 0.00 | |
| Chande Momentum Oscillator (20): | 0.170 | |
| Repulse (5,40,3): | 10.2700 | |
| ROCnROLL: | 1 | |
| TRIX (15,9): | -0.2220 | |
| Courbe Coppock: | 6.32 |
| MA7: | 0.873 | |
| MA20: | 0.845 | |
| MA50: | 0.874 | |
| MA100: | 0.988 | |
| MAexp7: | 0.880 | |
| MAexp20: | 0.858 | |
| MAexp50: | 0.900 | |
| MAexp100: | 1.018 | |
| Price / MA7: | +11.11% | |
| Price / MA20: | +14.79% | |
| Price / MA50: | +10.98% | |
| Price / MA100: | -1.82% | |
| Price / MAexp7: | +10.23% | |
| Price / MAexp20: | +13.05% | |
| Price / MAexp50: | +7.78% | |
| Price / MAexp100: | -4.72% |
About author
Online


Add a comment
Comments
0 comments on the analysis IVISION TECH - Daily