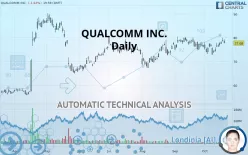
QUALCOMM INC. - Daily - Technical analysis published on 10/21/2019 (GMT)
- 420
- 0
- Who voted?
Click here for a new analysis!
- Timeframe : Daily
- - Analysis generated on
- Status : TARGET REACHED

Summary of the analysis

Additional analysis
Quotes
The QUALCOMM INC. price is 77.68 USD. The price is lower by -1.63% since the last closing with the lowest point at 77.67 USD and the highest point at 79.22 USD. The deviation from the price is +0.01% for the low point and -1.94% for the high point.A bearish opening was detected by the Central Gaps scanner. Sellers are trying to impose a bearish trend in the very short term.
Bearish opening
Type : Bearish
Timeframe : Openning
So that you have an overall view of the price change, here is a table showing the variations over several periods:
Near a new HIGH record (1 month)
Type : Bullish
Timeframe : Weekly
Technical
A technical analysis in Daily of this QUALCOMM INC. chart shows a strongly bullish trend. 92.86% of the signals given by moving averages are bullish. This strongly bullish trend is supported by the strong bullish signals given by short-term moving averages. An assessment of moving averages reveals a bullish signal that could impact this trend:
Bullish trend reversal : Moving Average 20
Type : Bullish
Timeframe : Daily
The probability of a further increase are moderate given the direction of the technical indicators.
Caution: the Central Indicators scanner currently detects an excess:
CCI indicator is overbought : over 100
Type : Neutral
Timeframe : Daily
Williams %R indicator is overbought : over -20
Type : Neutral
Timeframe : Daily
Pivot points : price is under support 1
Type : Neutral
Timeframe : Daily
The Central Patterns scanner, which studies chart patterns, resistances and supports, has identified these signals:
Near resistance of channel
Type : Bearish
Timeframe : Daily
Near resistance of triangle
Type : Bearish
Timeframe : Daily
The presence of a bullish Japanese candlestick pattern detected by Central Candlesticks that could cause a very short term rebound was also detected:
Upside gap
Type : Bullish
Timeframe : Daily
| S3 | S2 | S1 | Price | R1 | R2 | R3 | |
|---|---|---|---|---|---|---|---|
| ProTrendLines | 59.47 | 69.70 | 75.09 | 77.68 | 81.60 | 86.26 | 89.29 |
| Change (%) | -23.44% | -10.27% | -3.33% | - | +5.05% | +11.05% | +14.95% |
| Change | -18.21 | -7.98 | -2.59 | - | +3.92 | +8.58 | +11.61 |
| Level | Major | Major | Major | - | Intermediate | Minor | Major |
Attention could also be paid to pivot points to set price objectives:
| Pivot points | S3 | S2 | S1 | PP | R1 | R2 | R3 |
|---|---|---|---|---|---|---|---|
| Standard | 76.70 | 77.55 | 78.26 | 79.11 | 79.82 | 80.67 | 81.38 |
| Camarilla | 78.54 | 78.68 | 78.83 | 78.97 | 79.11 | 79.26 | 79.40 |
| Woodie | 76.63 | 77.52 | 78.19 | 79.08 | 79.75 | 80.64 | 81.31 |
| Fibonacci | 77.55 | 78.15 | 78.51 | 79.11 | 79.71 | 80.07 | 80.67 |
| Pivot points | S3 | S2 | S1 | PP | R1 | R2 | R3 |
|---|---|---|---|---|---|---|---|
| Standard | 68.72 | 70.77 | 73.73 | 75.78 | 78.74 | 80.79 | 83.75 |
| Camarilla | 75.32 | 75.78 | 76.24 | 76.70 | 77.16 | 77.62 | 78.08 |
| Woodie | 69.19 | 71.00 | 74.20 | 76.01 | 79.21 | 81.02 | 84.22 |
| Fibonacci | 70.77 | 72.68 | 73.86 | 75.78 | 77.69 | 78.87 | 80.79 |
| Pivot points | S3 | S2 | S1 | PP | R1 | R2 | R3 |
|---|---|---|---|---|---|---|---|
| Standard | 67.64 | 70.88 | 73.58 | 76.81 | 79.52 | 82.75 | 85.46 |
| Camarilla | 74.65 | 75.19 | 75.74 | 76.28 | 76.82 | 77.37 | 77.91 |
| Woodie | 67.37 | 70.74 | 73.31 | 76.68 | 79.25 | 82.62 | 85.19 |
| Fibonacci | 70.88 | 73.14 | 74.55 | 76.81 | 79.08 | 80.48 | 82.75 |
Numerical data
The following is the status of the technical indicators and moving averages at the time of publication of this technical analysis:
| RSI (14): | 53.79 | |
| MACD (12,26,9): | 0.4100 | |
| Directional Movement: | 7.47 | |
| AROON (14): | 50.00 | |
| DEMA (21): | 77.17 | |
| Parabolic SAR (0,02-0,02-0,2): | 74.03 | |
| Elder Ray (13): | 1.53 | |
| Super Trend (3,10): | 80.57 | |
| Zig ZAG (10): | 77.68 | |
| VORTEX (21): | 0.9500 | |
| Stochastique (14,3,5): | 84.21 | |
| TEMA (21): | 77.19 | |
| Williams %R (14): | -31.89 | |
| Chande Momentum Oscillator (20): | 3.69 | |
| Repulse (5,40,3): | -1.3700 | |
| ROCnROLL: | 1 | |
| TRIX (15,9): | 0.0200 | |
| Courbe Coppock: | 2.19 |
| MA7: | 77.24 | |
| MA20: | 76.34 | |
| MA50: | 75.82 | |
| MA100: | 73.92 | |
| MAexp7: | 77.39 | |
| MAexp20: | 76.70 | |
| MAexp50: | 75.84 | |
| MAexp100: | 73.86 | |
| Price / MA7: | +0.57% | |
| Price / MA20: | +1.76% | |
| Price / MA50: | +2.45% | |
| Price / MA100: | +5.09% | |
| Price / MAexp7: | +0.37% | |
| Price / MAexp20: | +1.28% | |
| Price / MAexp50: | +2.43% | |
| Price / MAexp100: | +5.17% |
News
The latest news and videos published on QUALCOMM INC. at the time of the analysis were as follows:
- Qualcomm Announces Quarterly Cash Dividend
- UROS, Thundercomm to Open IoT and 5G Innovation Center in Finland Utilizing Tech From Qualcomm Technologies
- Trimble and Qualcomm Establish Alliance to Produce High-Accuracy Positioning Solutions for Connected Vehicles
- Vuzix to Participate in the First Qualcomm Smart Cities Accelerate Event
- Fibocom Wireless Participates in Qualcomm Smart Cities Accelerator Program to Collaborate on Global IoT Application Innovations
About author

Online


Add a comment
Comments
0 comments on the analysis QUALCOMM INC. - Daily