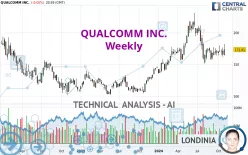
QUALCOMM INC. - Weekly - Technical analysis published on 11/08/2024 (GMT)
- 191
- 0
- Timeframe : Weekly
- - Analysis generated on
- Status : CANCELLED

Summary of the analysis

Additional analysis
Quotes
The QUALCOMM INC. price is 172.91 USD. The price registered an increase of +4.62% over 5 days and was traded between 163.64 USD and 182.10 USD over the period. The price is currently at +5.67% from its lowest point and -5.05% from its highest point.The Central Gaps scanner detects a bullish gap which is a sign that buyers have taken the lead in the very short term.
Opening Gap UP
Type : Bullish
Timeframe : Openning
A study of price movements over other periods shows the following variations:
New HIGH record (1 month)
Type : Bullish
Timeframe : Weekly
Technical
Technical analysis of this Weekly chart of QUALCOMM INC. indicates that the overall trend is strongly bullish. 82.14% of the signals given by moving averages are bullish. The slightly bullish signals given by the short-term moving averages indicate this trend is showing signs of running out of steam. The Central Indicators scanner detects bullish signals on moving averages that could impact this trend:
Bullish price crossover with Moving Average 50
Type : Bullish
Timeframe : Weekly
Bullish price crossover with adaptative moving average 50
Type : Bullish
Timeframe : Weekly
The probability of a further increase are moderate given the direction of the technical indicators.
Other results related to technical indicators were also found by the Central Indicators scanner:
RSI indicator is back over 50
Type : Bullish
Timeframe : Weekly
Parabolic SAR indicator bullish reversal
Type : Bullish
Timeframe : Weekly
Aroon indicator bullish trend
Type : Bullish
Timeframe : Weekly
Price is back over the pivot point
Type : Bullish
Timeframe : Weekly
Williams %R indicator is back over -50
Type : Bullish
Timeframe : Weekly
The Central Patterns scanner, which studies chart patterns, resistances and supports, has identified these signals:
Near horizontal resistance
Type : Bearish
Timeframe : Weekly
Near resistance of channel
Type : Bearish
Timeframe : Weekly
The presence of a bullish Japanese candlestick pattern detected by Central Candlesticks that could cause a very short term rebound was also detected:
Bullish engulfing lines
Type : Bullish
Timeframe : Weekly
| S3 | S2 | S1 | Price | R1 | R2 | R3 | |
|---|---|---|---|---|---|---|---|
| ProTrendLines | 114.80 | 132.71 | 152.01 | 172.91 | 177.88 | 208.56 | 225.92 |
| Change (%) | -33.61% | -23.25% | -12.09% | - | +2.87% | +20.62% | +30.66% |
| Change | -58.11 | -40.20 | -20.90 | - | +4.97 | +35.65 | +53.01 |
| Level | Intermediate | Intermediate | Major | - | Major | Intermediate | Major |
Pivot points can also be used to set your price objectives. Here is the price situation in relation to pivot points:
| Pivot points | S3 | S2 | S1 | PP | R1 | R2 | R3 |
|---|---|---|---|---|---|---|---|
| Standard | 158.52 | 165.08 | 168.99 | 175.55 | 179.46 | 186.02 | 189.93 |
| Camarilla | 170.03 | 170.99 | 171.95 | 172.91 | 173.87 | 174.83 | 175.79 |
| Woodie | 157.21 | 164.42 | 167.68 | 174.89 | 178.15 | 185.36 | 188.62 |
| Fibonacci | 165.08 | 169.08 | 171.55 | 175.55 | 179.55 | 182.02 | 186.02 |
| Pivot points | S3 | S2 | S1 | PP | R1 | R2 | R3 |
|---|---|---|---|---|---|---|---|
| Standard | 144.89 | 153.48 | 159.38 | 167.97 | 173.87 | 182.46 | 188.36 |
| Camarilla | 161.29 | 162.61 | 163.94 | 165.27 | 166.60 | 167.93 | 169.26 |
| Woodie | 143.54 | 152.81 | 158.03 | 167.30 | 172.52 | 181.79 | 187.01 |
| Fibonacci | 153.48 | 159.02 | 162.44 | 167.97 | 173.51 | 176.93 | 182.46 |
| Pivot points | S3 | S2 | S1 | PP | R1 | R2 | R3 |
|---|---|---|---|---|---|---|---|
| Standard | 138.89 | 150.48 | 156.63 | 168.22 | 174.37 | 185.96 | 192.11 |
| Camarilla | 157.89 | 159.52 | 161.14 | 162.77 | 164.40 | 166.02 | 167.65 |
| Woodie | 136.16 | 149.12 | 153.90 | 166.86 | 171.64 | 184.60 | 189.38 |
| Fibonacci | 150.48 | 157.26 | 161.45 | 168.22 | 175.00 | 179.19 | 185.96 |
Numerical data
The following is the status of technical indicators and moving averages registered at the time this technical analysis was created:
| RSI (14): | 50.67 | |
| MACD (12,26,9): | -1.0600 | |
| Directional Movement: | 4.87 | |
| AROON (14): | 92.86 | |
| DEMA (21): | 172.44 | |
| Parabolic SAR (0,02-0,02-0,2): | 150.61 | |
| Elder Ray (13): | 1.54 | |
| Super Trend (3,10): | 204.84 | |
| Zig ZAG (10): | 172.91 | |
| VORTEX (21): | 0.8500 | |
| Stochastique (14,3,5): | 54.01 | |
| TEMA (21): | 165.42 | |
| Williams %R (14): | -29.19 | |
| Chande Momentum Oscillator (20): | 1.61 | |
| Repulse (5,40,3): | -0.3200 | |
| ROCnROLL: | 1 | |
| TRIX (15,9): | 0.0000 | |
| Courbe Coppock: | 12.96 |
| MA7: | 167.52 | |
| MA20: | 170.18 | |
| MA50: | 168.43 | |
| MA100: | 176.47 | |
| MAexp7: | 169.92 | |
| MAexp20: | 172.48 | |
| MAexp50: | 165.09 | |
| MAexp100: | 151.62 | |
| Price / MA7: | +3.22% | |
| Price / MA20: | +1.60% | |
| Price / MA50: | +2.66% | |
| Price / MA100: | -2.02% | |
| Price / MAexp7: | +1.76% | |
| Price / MAexp20: | +0.25% | |
| Price / MAexp50: | +4.74% | |
| Price / MAexp100: | +14.04% |
News
Don't forget to follow the news on QUALCOMM INC.. At the time of publication of this analysis, the latest news was as follows:
- HONEYWELL AND QUALCOMM WORK TO REVOLUTIONIZE ENERGY SECTOR WITH 5G, LOW POWER WIRELESS AND AI-ENABLED SOLUTIONS
- Aprecomm Teams up with Qualcomm to Boost Network Application Intelligence
- Qualcomm, Aramco and RDIA Plan Design in Saudi Arabia Startup Program
- Honeywell to Develop Artificial Intelligence-Enabled Agent Powered by Qualcomm
- Samsung Electro-Mechanics Awarded "2024 Supplier of the Year - Components" at Qualcomm Suplier Summit
About author

Online


Add a comment
Comments
0 comments on the analysis QUALCOMM INC. - Weekly