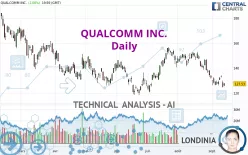
QUALCOMM INC. - Daily - Technical analysis published on 09/15/2022 (GMT)
- 332
- 0
Click here for a new analysis!
- Timeframe : Daily
- - Analysis generated on
- Status : TARGET REACHED

Summary of the analysis

Additional analysis
Quotes
The QUALCOMM INC. price is 127.53 USD. On the day, this instrument gained +2.08% and was traded between 125.50 USD and 127.90 USD over the period. The price is currently at +1.62% from its lowest and -0.29% from its highest.A bullish opening was detected by the Central Gaps scanner. Buyers are trying to impose a bullish momentum in the very short term.
Bullish opening
Type : Bullish
Timeframe : Openning
Here is a more detailed summary of the historical variations registered by QUALCOMM INC.:
Near a new LOW record (1 month)
Type : Bearish
Timeframe : Weekly
Technical
A technical analysis in Daily of this QUALCOMM INC. chart shows a sharp bearish trend. 82.14% of the signals given by moving averages are bearish. The overall trend is supported by the strong bearish signals from short-term moving averages. There is no crossing of moving average by the price or crossing of moving averages between themselves.
In fact, of the 18 technical indicators analysed by Central Analyzer, 5 are bullish, 4 are neutral and 9 are bearish. Caution: the Central Indicators scanner currently detects an excess:
CCI indicator: bullish divergence
Type : Bullish
Timeframe : Daily
RSI indicator: bullish divergence
Type : Bullish
Timeframe : Daily
Williams %R indicator is oversold : under -80
Type : Neutral
Timeframe : Daily
Pivot points : price is under support 1
Type : Neutral
Timeframe : Weekly
Price is back over the pivot point
Type : Bullish
Timeframe : Daily
Central Patterns, the market scanner focusing on chart patterns, resistances and supports found these results:
Near horizontal resistance
Type : Bearish
Timeframe : Daily
Near support of channel
Type : Bullish
Timeframe : Daily
The presence of a bullish Japanese candlestick pattern detected by Central Candlesticks that could cause a very short term rebound was also detected:
Bullish harami
Type : Bullish
Timeframe : Daily
| S3 | S2 | S1 | Price | R1 | R2 | R3 | |
|---|---|---|---|---|---|---|---|
| ProTrendLines | 105.69 | 120.54 | 126.91 | 127.53 | 147.12 | 159.34 | 174.03 |
| Change (%) | -17.13% | -5.48% | -0.49% | - | +15.36% | +24.94% | +36.46% |
| Change | -21.84 | -6.99 | -0.62 | - | +19.59 | +31.81 | +46.50 |
| Level | Minor | Major | Intermediate | - | Intermediate | Major | Minor |
To determine price objectives, it is also possible to use the pivot points. Here is the price position in relation to pivot points:
| Pivot points | S3 | S2 | S1 | PP | R1 | R2 | R3 |
|---|---|---|---|---|---|---|---|
| Standard | 123.65 | 124.58 | 126.05 | 126.98 | 128.45 | 129.38 | 130.85 |
| Camarilla | 126.87 | 127.09 | 127.31 | 127.53 | 127.75 | 127.97 | 128.19 |
| Woodie | 123.93 | 124.72 | 126.33 | 127.12 | 128.73 | 129.52 | 131.13 |
| Fibonacci | 124.58 | 125.49 | 126.06 | 126.98 | 127.89 | 128.46 | 129.38 |
| Pivot points | S3 | S2 | S1 | PP | R1 | R2 | R3 |
|---|---|---|---|---|---|---|---|
| Standard | 121.05 | 123.48 | 127.76 | 130.19 | 134.47 | 136.90 | 141.18 |
| Camarilla | 130.21 | 130.82 | 131.44 | 132.05 | 132.67 | 133.28 | 133.90 |
| Woodie | 121.99 | 123.94 | 128.70 | 130.65 | 135.41 | 137.36 | 142.12 |
| Fibonacci | 123.48 | 126.04 | 127.62 | 130.19 | 132.75 | 134.33 | 136.90 |
| Pivot points | S3 | S2 | S1 | PP | R1 | R2 | R3 |
|---|---|---|---|---|---|---|---|
| Standard | 104.27 | 117.78 | 125.03 | 138.54 | 145.79 | 159.30 | 166.55 |
| Camarilla | 126.56 | 128.46 | 130.37 | 132.27 | 134.17 | 136.08 | 137.98 |
| Woodie | 101.13 | 116.22 | 121.89 | 136.98 | 142.65 | 157.74 | 163.41 |
| Fibonacci | 117.78 | 125.71 | 130.61 | 138.54 | 146.47 | 151.37 | 159.30 |
Numerical data
The following are the details of the technical indicators and moving averages that were collected to generate this technical analysis:
| RSI (14): | 38.75 | |
| MACD (12,26,9): | -4.2500 | |
| Directional Movement: | -15.65 | |
| AROON (14): | -78.57 | |
| DEMA (21): | 129.02 | |
| Parabolic SAR (0,02-0,02-0,2): | 134.22 | |
| Elder Ray (13): | -4.96 | |
| Super Trend (3,10): | 140.12 | |
| Zig ZAG (10): | 127.53 | |
| VORTEX (21): | 0.7400 | |
| Stochastique (14,3,5): | 16.73 | |
| TEMA (21): | 125.47 | |
| Williams %R (14): | -86.21 | |
| Chande Momentum Oscillator (20): | -10.08 | |
| Repulse (5,40,3): | -1.0300 | |
| ROCnROLL: | 2 | |
| TRIX (15,9): | -0.3700 | |
| Courbe Coppock: | 19.65 |
| MA7: | 128.80 | |
| MA20: | 135.58 | |
| MA50: | 141.07 | |
| MA100: | 136.99 | |
| MAexp7: | 129.25 | |
| MAexp20: | 134.10 | |
| MAexp50: | 137.76 | |
| MAexp100: | 139.85 | |
| Price / MA7: | -0.99% | |
| Price / MA20: | -5.94% | |
| Price / MA50: | -9.60% | |
| Price / MA100: | -6.91% | |
| Price / MAexp7: | -1.33% | |
| Price / MAexp20: | -4.90% | |
| Price / MAexp50: | -7.43% | |
| Price / MAexp100: | -8.81% |
News
The last news published on QUALCOMM INC. at the time of the generation of this analysis was as follows:
- GlobalFoundries and Qualcomm Announce Extension of Long-term Agreement to Secure U.S. Supply through 2028
- Qualcomm Becomes Official Global Partner of Manchester United
-
 Qualcomm CEO: This is a 'significant milestone'
- Qualcomm Earnings Release Available on Company's Investor Relations Website
- Qualcomm Earnings Release Available on Company's Investor Relations Website
About author

Online


Add a comment
Comments
0 comments on the analysis QUALCOMM INC. - Daily