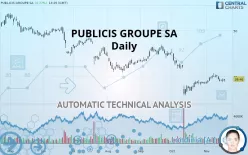
PUBLICIS GROUPE SA - Daily - Technical analysis published on 11/19/2019 (GMT)
- 416
- 0
- Who voted?
Click here for a new analysis!
- Timeframe : Daily
- - Analysis generated on
- Status : LEVEL MAINTAINED

Summary of the analysis

Additional analysis
Quotes
The PUBLICIS GROUPE SA price is 39.46 EUR. On the day, this instrument gained +0.77% and was traded between 38.98 EUR and 39.52 EUR over the period. The price is currently at +1.23% from its lowest and -0.15% from its highest.The Central Gaps scanner detects a bullish opening. A small advantage for buyers in the very short term.
Bullish opening
Type : Bullish
Timeframe : Openning
A study of price movements over other periods shows the following variations:
Near a new HIGH record (1 month)
Type : Bullish
Timeframe : Weekly
Technical
A technical analysis in Daily of this PUBLICIS GROUPE SA chart shows a sharp bearish trend. 82.14% of the signals given by moving averages are bearish. Caution: as the signals currently given by short-term moving averages are rather neutral, the strongly bearish trend is showing signs of running out of steam. An assessment of moving averages reveals a bearish signal that could impact this trend:
Bearish price crossover with Moving Average 20
Type : Bearish
Timeframe : Daily
The technical indicators are generally neutral. They do not provide relevant information on the direction of future price movements.
Central Indicators, the scanner specialised in technical indicators, has identified these signals:
Price is back under the pivot point
Type : Bearish
Timeframe : Daily
Price is back under the pivot point
Type : Bearish
Timeframe : Weekly
Central Patterns, the market scanner focusing on chart patterns, resistances and supports found this result:
Near resistance of channel
Type : Bearish
Timeframe : Daily
The presence of a bearish pattern in Japanese candlesticks detected by Central Candlesticks that could cause a correction in the very short term was also detected:
Bearish engulfing lines
Type : Bearish
Timeframe : Daily
| S3 | S2 | S1 | Price | R1 | R2 | R3 | |
|---|---|---|---|---|---|---|---|
| ProTrendLines | 29.48 | 36.57 | 38.52 | 39.46 | 41.33 | 46.62 | 50.78 |
| Change (%) | -25.29% | -7.32% | -2.38% | - | +4.74% | +18.14% | +28.69% |
| Change | -9.98 | -2.89 | -0.94 | - | +1.87 | +7.16 | +11.32 |
| Level | Intermediate | Major | Intermediate | - | Intermediate | Intermediate | Intermediate |
To determine price objectives, it is also possible to use the pivot points. Here is the price position in relation to pivot points:
| Pivot points | S3 | S2 | S1 | PP | R1 | R2 | R3 |
|---|---|---|---|---|---|---|---|
| Standard | 38.00 | 38.43 | 38.79 | 39.22 | 39.58 | 40.01 | 40.37 |
| Camarilla | 38.94 | 39.02 | 39.09 | 39.16 | 39.23 | 39.31 | 39.38 |
| Woodie | 37.98 | 38.41 | 38.77 | 39.20 | 39.56 | 39.99 | 40.35 |
| Fibonacci | 38.43 | 38.73 | 38.92 | 39.22 | 39.52 | 39.71 | 40.01 |
| Pivot points | S3 | S2 | S1 | PP | R1 | R2 | R3 |
|---|---|---|---|---|---|---|---|
| Standard | 37.18 | 38.08 | 38.69 | 39.59 | 40.20 | 41.10 | 41.71 |
| Camarilla | 38.89 | 39.02 | 39.16 | 39.30 | 39.44 | 39.58 | 39.72 |
| Woodie | 37.04 | 38.01 | 38.55 | 39.52 | 40.06 | 41.03 | 41.57 |
| Fibonacci | 38.08 | 38.66 | 39.01 | 39.59 | 40.17 | 40.52 | 41.10 |
| Pivot points | S3 | S2 | S1 | PP | R1 | R2 | R3 |
|---|---|---|---|---|---|---|---|
| Standard | 24.28 | 30.13 | 34.34 | 40.19 | 44.40 | 50.25 | 54.46 |
| Camarilla | 35.78 | 36.71 | 37.63 | 38.55 | 39.47 | 40.39 | 41.32 |
| Woodie | 23.46 | 29.72 | 33.52 | 39.78 | 43.58 | 49.84 | 53.64 |
| Fibonacci | 30.13 | 33.97 | 36.35 | 40.19 | 44.03 | 46.41 | 50.25 |
Numerical data
The following is the status of technical indicators and moving averages registered at the time this technical analysis was created:
| RSI (14): | 47.30 | |
| MACD (12,26,9): | -0.3000 | |
| Directional Movement: | -4.15 | |
| AROON (14): | 42.86 | |
| DEMA (21): | 39.02 | |
| Parabolic SAR (0,02-0,02-0,2): | 40.63 | |
| Elder Ray (13): | -0.21 | |
| Super Trend (3,10): | 41.25 | |
| Zig ZAG (10): | 39.52 | |
| VORTEX (21): | 1.1000 | |
| Stochastique (14,3,5): | 37.63 | |
| TEMA (21): | 39.50 | |
| Williams %R (14): | -54.08 | |
| Chande Momentum Oscillator (20): | 0.65 | |
| Repulse (5,40,3): | 0.5100 | |
| ROCnROLL: | -1 | |
| TRIX (15,9): | -0.1700 | |
| Courbe Coppock: | 4.43 |
| MA7: | 39.56 | |
| MA20: | 39.28 | |
| MA50: | 41.37 | |
| MA100: | 42.88 | |
| MAexp7: | 39.45 | |
| MAexp20: | 39.56 | |
| MAexp50: | 40.75 | |
| MAexp100: | 42.41 | |
| Price / MA7: | -0.25% | |
| Price / MA20: | +0.46% | |
| Price / MA50: | -4.62% | |
| Price / MA100: | -7.98% | |
| Price / MAexp7: | +0.03% | |
| Price / MAexp20: | -0.25% | |
| Price / MAexp50: | -3.17% | |
| Price / MAexp100: | -6.96% |
News
Don"t forget to follow the news on PUBLICIS GROUPE SA. At the time of publication of this analysis, the latest news was as follows:
- Publicis Groupe: Invitation
- Publicis Groupe: Third Quarter 2019 Revenue
- Publicis Groupe acquires US based full-service marketing agency Rauxa
- Publicis Drugstore and Plexal in new partnership to help startups and corporates collaborate
- Publicis Communications Production Company, Prodigious, Acquires Translate Plus, Translation and Transcreation Company
About author

Online


Add a comment
Comments
0 comments on the analysis PUBLICIS GROUPE SA - Daily