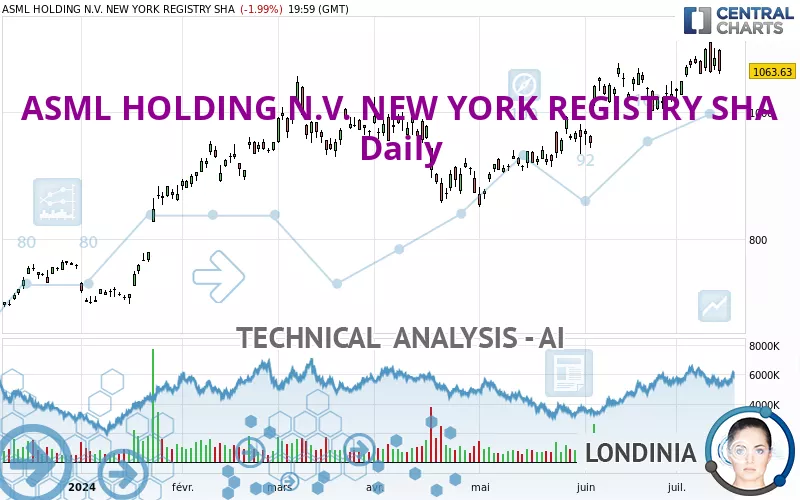
ASML HOLDING N.V. NEW YORK REGISTRY SHA - Daily - Technical analysis published on 07/16/2024 (GMT)
- 228
- 0
Click here for a new analysis!
- Timeframe : Daily
- - Analysis generated on
- Status : INVALID

Summary of the analysis

Additional analysis
Quotes
The ASML HOLDING N.V. NEW YORK REGISTRY SHA price is 1,063.63 USD. The price registered a decrease of -1.99% on the session and was between 1,060.37 USD and 1,098.73 USD. This implies that the price is at +0.31% from its lowest and at -3.19% from its highest.The Central Gaps scanner detects a bullish opening. A small advantage for buyers in the very short term.
Bullish opening
Type : Bullish
Timeframe : Openning
So that you have an overall view of the price change, here is a table showing the variations over several periods:
Near a new HIGH record (5 years)
Type : Bullish
Timeframe : Weekly
Near a new HIGH record (1 year)
Type : Bullish
Timeframe : Weekly
Near a new HIGH record (1st january)
Type : Bullish
Timeframe : Weekly
Near a new HIGH record (1 month)
Type : Bullish
Timeframe : Weekly
Technical
Technical analysis of ASML HOLDING N.V. NEW YORK REGISTRY SHA in Daily shows a strongly overall bullish trend. The signals given by the moving averages are 92.86% bullish. This strong bullish trend is confirmed by the strong signals currently being given by short-term moving averages. There is no crossing of moving average by the price or crossing of moving averages between themselves.
An assessment of technical indicators does not currently provide any relevant information to suggest whether the signal given by the technical indicators is more bullish or bearish.
Other results related to technical indicators were also found by the Central Indicators scanner:
Pivot points : price is under support 1
Type : Neutral
Timeframe : Daily
MACD crosses DOWN its Moving Average
Type : Bearish
Timeframe : Daily
Price is back under the pivot point
Type : Bearish
Timeframe : Weekly
Central Patterns, the market scanner focusing on chart patterns, resistances and supports found these results:
Near horizontal support
Type : Bullish
Timeframe : Daily
Support of channel is broken
Type : Bearish
Timeframe : Daily
The presence of a bearish pattern in Japanese candlesticks detected by Central Candlesticks that could cause a correction in the very short term was also detected:
Bearish engulfing lines
Type : Bearish
Timeframe : Daily
| S3 | S2 | S1 | Price | |
|---|---|---|---|---|
| ProTrendLines | 694.41 | 870.08 | 1,045.19 | 1,063.63 |
| Change (%) | -34.71% | -18.20% | -1.73% | - |
| Change | -369.22 | -193.55 | -18.44 | - |
| Level | Major | Major | Major | - |
Attention could also be paid to pivot points to set price objectives:
| Pivot points | S3 | S2 | S1 | PP | R1 | R2 | R3 |
|---|---|---|---|---|---|---|---|
| Standard | 1,011.40 | 1,035.88 | 1,049.76 | 1,074.24 | 1,088.12 | 1,112.60 | 1,126.48 |
| Camarilla | 1,053.08 | 1,056.60 | 1,060.11 | 1,063.63 | 1,067.15 | 1,070.66 | 1,074.18 |
| Woodie | 1,006.09 | 1,033.23 | 1,044.45 | 1,071.59 | 1,082.81 | 1,109.95 | 1,121.17 |
| Fibonacci | 1,035.88 | 1,050.54 | 1,059.59 | 1,074.24 | 1,088.90 | 1,097.95 | 1,112.60 |
| Pivot points | S3 | S2 | S1 | PP | R1 | R2 | R3 |
|---|---|---|---|---|---|---|---|
| Standard | 1,008.97 | 1,034.16 | 1,059.71 | 1,084.90 | 1,110.45 | 1,135.64 | 1,161.19 |
| Camarilla | 1,071.31 | 1,075.96 | 1,080.61 | 1,085.26 | 1,089.91 | 1,094.56 | 1,099.21 |
| Woodie | 1,009.15 | 1,034.25 | 1,059.89 | 1,084.99 | 1,110.63 | 1,135.73 | 1,161.37 |
| Fibonacci | 1,034.16 | 1,053.54 | 1,065.52 | 1,084.90 | 1,104.28 | 1,116.26 | 1,135.64 |
| Pivot points | S3 | S2 | S1 | PP | R1 | R2 | R3 |
|---|---|---|---|---|---|---|---|
| Standard | 817.19 | 880.10 | 951.41 | 1,014.32 | 1,085.63 | 1,148.54 | 1,219.85 |
| Camarilla | 985.82 | 998.12 | 1,010.43 | 1,022.73 | 1,035.03 | 1,047.34 | 1,059.64 |
| Woodie | 821.40 | 882.20 | 955.62 | 1,016.42 | 1,089.84 | 1,150.64 | 1,224.06 |
| Fibonacci | 880.10 | 931.37 | 963.05 | 1,014.32 | 1,065.59 | 1,097.27 | 1,148.54 |
Numerical data
The following is the status of technical indicators and moving averages registered at the time this technical analysis was created:
| RSI (14): | 54.83 | |
| MACD (12,26,9): | 21.2100 | |
| Directional Movement: | 11.35 | |
| AROON (14): | 85.71 | |
| DEMA (21): | 1,079.52 | |
| Parabolic SAR (0,02-0,02-0,2): | 1,039.41 | |
| Elder Ray (13): | 18.56 | |
| Super Trend (3,10): | 1,008.06 | |
| Zig ZAG (10): | 1,063.63 | |
| VORTEX (21): | 0.9300 | |
| Stochastique (14,3,5): | 63.25 | |
| TEMA (21): | 1,080.59 | |
| Williams %R (14): | -43.24 | |
| Chande Momentum Oscillator (20): | 47.03 | |
| Repulse (5,40,3): | -5.4400 | |
| ROCnROLL: | 1 | |
| TRIX (15,9): | 0.3200 | |
| Courbe Coppock: | 7.43 |
| MA7: | 1,074.60 | |
| MA20: | 1,049.84 | |
| MA50: | 995.10 | |
| MA100: | 972.69 | |
| MAexp7: | 1,069.46 | |
| MAexp20: | 1,050.35 | |
| MAexp50: | 1,010.94 | |
| MAexp100: | 960.85 | |
| Price / MA7: | -1.02% | |
| Price / MA20: | +1.31% | |
| Price / MA50: | +6.89% | |
| Price / MA100: | +9.35% | |
| Price / MAexp7: | -0.55% | |
| Price / MAexp20: | +1.26% | |
| Price / MAexp50: | +5.21% | |
| Price / MAexp100: | +10.70% |
About author

Online


Add a comment
Comments
0 comments on the analysis ASML HOLDING N.V. NEW YORK REGISTRY SHA - Daily