ASML HOLDING N.V. NEW YORK REGISTRY SHA - Weekly - Technical analysis published on 07/16/2024 (GMT)
- 137
- 0
Click here for a new analysis!
- Timeframe : Weekly
- - Analysis generated on
- Status : INVALID
Summary of the analysis

Additional analysis
Quotes
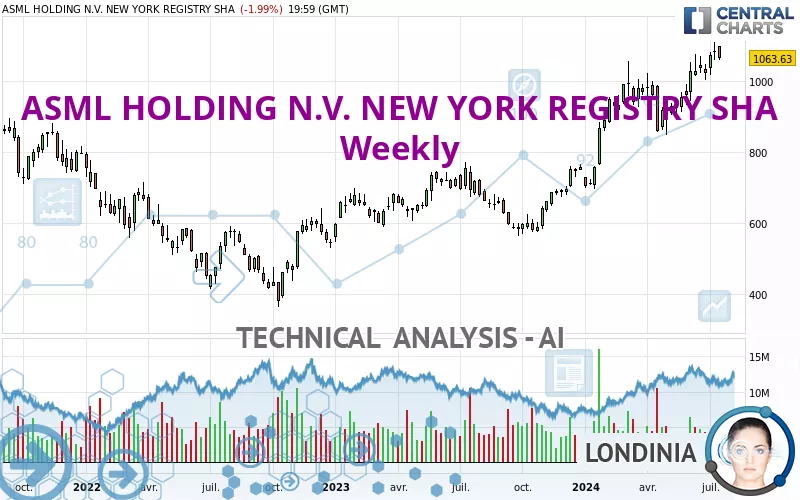
The ASML HOLDING N.V. NEW YORK REGISTRY SHA price is 1,063.63 USD. The price registered an increase of +0.35% over 5 days and has been traded over the last 5 days between 1,060.37 USD and 1,100.62 USD. This implies that the 5 day price is +0.31% from its lowest point and -3.36% from its highest point.The Central Gaps scanner detects a bullish opening. A small advantage for buyers in the very short term.
Bullish opening
Type : Bullish
Timeframe : Openning
A study of price movements over other periods shows the following variations:
Near a new HIGH record (5 years)
Type : Bullish
Timeframe : Weekly
Near a new HIGH record (1 year)
Type : Bullish
Timeframe : Weekly
Near a new HIGH record (1st january)
Type : Bullish
Timeframe : Weekly
Near a new HIGH record (1 month)
Type : Bullish
Timeframe : Weekly
Technical
Technical analysis of ASML HOLDING N.V. NEW YORK REGISTRY SHA in Weekly shows a strongly overall bullish trend. The signals given by the moving averages are 92.86% bullish. This strong bullish trend is confirmed by the strong signals currently being given by short-term moving averages. The Central Indicators market scanner currently does not detect any result that concerns moving averages.
In fact, according to the parameters integrated into the Central Analyzer system, 13 technical indicators out of 18 analysed are currently bullish. Caution: the Central Indicators scanner currently detects an excess:
CCI indicator is overbought : over 100
Type : Neutral
Timeframe : Weekly
CCI indicator: bearish divergence
Type : Bearish
Timeframe : Weekly
MACD indicator: bearish divergence
Type : Bullish
Timeframe : Weekly
RSI indicator: bearish divergence
Type : Bearish
Timeframe : Weekly
Williams %R indicator is overbought : over -20
Type : Neutral
Timeframe : Weekly
Price is back under the pivot point
Type : Bearish
Timeframe : Weekly
An analysis of the price chart with the Central Patterns scanner (detector of chart patterns and resistances and supports) shows a result that can have an impact on the price change:
Near horizontal support
Type : Bullish
Timeframe : Weekly
The presence of a bearish pattern in Japanese candlesticks detected by Central Candlesticks that could cause a correction in the very short term was also detected:
Bearish engulfing lines
Type : Bearish
Timeframe : Weekly
| S3 | S2 | S1 | Price | |
|---|---|---|---|---|
| ProTrendLines | 694.41 | 870.08 | 1,045.19 | 1,063.63 |
| Change (%) | -34.71% | -18.20% | -1.73% | - |
| Change | -369.22 | -193.55 | -18.44 | - |
| Level | Major | Major | Major | - |
Attention could also be paid to pivot points to set price objectives:
| Pivot points | S3 | S2 | S1 | PP | R1 | R2 | R3 |
|---|---|---|---|---|---|---|---|
| Standard | 1,011.40 | 1,035.88 | 1,049.76 | 1,074.24 | 1,088.12 | 1,112.60 | 1,126.48 |
| Camarilla | 1,053.08 | 1,056.60 | 1,060.11 | 1,063.63 | 1,067.15 | 1,070.66 | 1,074.18 |
| Woodie | 1,006.09 | 1,033.23 | 1,044.45 | 1,071.59 | 1,082.81 | 1,109.95 | 1,121.17 |
| Fibonacci | 1,035.88 | 1,050.54 | 1,059.59 | 1,074.24 | 1,088.90 | 1,097.95 | 1,112.60 |
| Pivot points | S3 | S2 | S1 | PP | R1 | R2 | R3 |
|---|---|---|---|---|---|---|---|
| Standard | 1,008.97 | 1,034.16 | 1,059.71 | 1,084.90 | 1,110.45 | 1,135.64 | 1,161.19 |
| Camarilla | 1,071.31 | 1,075.96 | 1,080.61 | 1,085.26 | 1,089.91 | 1,094.56 | 1,099.21 |
| Woodie | 1,009.15 | 1,034.25 | 1,059.89 | 1,084.99 | 1,110.63 | 1,135.73 | 1,161.37 |
| Fibonacci | 1,034.16 | 1,053.54 | 1,065.52 | 1,084.90 | 1,104.28 | 1,116.26 | 1,135.64 |
| Pivot points | S3 | S2 | S1 | PP | R1 | R2 | R3 |
|---|---|---|---|---|---|---|---|
| Standard | 817.19 | 880.10 | 951.41 | 1,014.32 | 1,085.63 | 1,148.54 | 1,219.85 |
| Camarilla | 985.82 | 998.12 | 1,010.43 | 1,022.73 | 1,035.03 | 1,047.34 | 1,059.64 |
| Woodie | 821.40 | 882.20 | 955.62 | 1,016.42 | 1,089.84 | 1,150.64 | 1,224.06 |
| Fibonacci | 880.10 | 931.37 | 963.05 | 1,014.32 | 1,065.59 | 1,097.27 | 1,148.54 |
Numerical data
The following are the details of the technical indicators and moving averages that were collected to generate this technical analysis:
| RSI (14): | 66.66 | |
| MACD (12,26,9): | 64.6700 | |
| Directional Movement: | 20.96 | |
| AROON (14): | 71.43 | |
| DEMA (21): | 1,063.47 | |
| Parabolic SAR (0,02-0,02-0,2): | 931.60 | |
| Elder Ray (13): | 68.98 | |
| Super Trend (3,10): | 905.15 | |
| Zig ZAG (10): | 1,063.63 | |
| VORTEX (21): | 1.1100 | |
| Stochastique (14,3,5): | 89.71 | |
| TEMA (21): | 1,073.89 | |
| Williams %R (14): | -17.80 | |
| Chande Momentum Oscillator (20): | 144.66 | |
| Repulse (5,40,3): | -1.5800 | |
| ROCnROLL: | 1 | |
| TRIX (15,9): | 1.0400 | |
| Courbe Coppock: | 20.16 |
| MA7: | 1,074.60 | |
| MA20: | 1,049.84 | |
| MA50: | 995.10 | |
| MA100: | 972.69 | |
| MAexp7: | 1,042.47 | |
| MAexp20: | 977.38 | |
| MAexp50: | 867.56 | |
| MAexp100: | 767.68 | |
| Price / MA7: | -1.02% | |
| Price / MA20: | +1.31% | |
| Price / MA50: | +6.89% | |
| Price / MA100: | +9.35% | |
| Price / MAexp7: | +2.03% | |
| Price / MAexp20: | +8.82% | |
| Price / MAexp50: | +22.60% | |
| Price / MAexp100: | +38.55% |
About author

Online


Add a comment
Comments
0 comments on the analysis ASML HOLDING N.V. NEW YORK REGISTRY SHA - Weekly