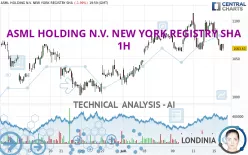
ASML HOLDING N.V. NEW YORK REGISTRY SHA - 1H - Technical analysis published on 07/16/2024 (GMT)
- 155
- 0
Click here for a new analysis!
- Timeframe : 1H
- - Analysis generated on
- Status : TARGET REACHED

Summary of the analysis

Additional analysis
Quotes
The ASML HOLDING N.V. NEW YORK REGISTRY SHA rating is 1,063.63 USD. The price registered a decrease of -1.99% on the session and was traded between 1,060.37 USD and 1,098.73 USD over the period. The price is currently at +0.31% from its lowest and -3.19% from its highest.The Central Gaps scanner detects a bullish opening marking the presence of buyers ahead of sellers at the opening but not sufficiently marked to allow the price to register a quotation gap.
Bullish opening
Type : Bullish
Timeframe : Openning
A study of price movements over other periods shows the following variations:
Near a new HIGH record (5 years)
Type : Bullish
Timeframe : Weekly
Near a new HIGH record (1 year)
Type : Bullish
Timeframe : Weekly
Near a new HIGH record (1st january)
Type : Bullish
Timeframe : Weekly
Near a new HIGH record (1 month)
Type : Bullish
Timeframe : Weekly
Technical
A technical analysis in 1H of this ASML HOLDING N.V. NEW YORK REGISTRY SHA chart shows a neutral trend. The strong bearish signals currently being given by short-term moving averages could allow the overall trend to return to a bearish trend. The Central Indicators market scanner currently does not detect any result that concerns moving averages.
In fact, according to the parameters integrated into the Central Analyzer system, 12 technical indicators out of 18 analysed are currently bearish. Caution: the Central Indicators scanner currently detects an excess:
Williams %R indicator is oversold : under -80
Type : Neutral
Timeframe : 1 hour
Pivot points : price is under support 1
Type : Neutral
Timeframe : 1 hour
Price is back under the pivot point
Type : Bearish
Timeframe : Weekly
Central Patterns, the scanner specializing in chart patterns, did not identify any signals.
The Central Candlesticks scanner which studies Japanese candlesticks did not detect anything.
| S3 | S2 | S1 | Price | R1 | R2 | |
|---|---|---|---|---|---|---|
| ProTrendLines | 1,016.22 | 1,045.19 | 1,061.74 | 1,063.63 | 1,077.22 | 1,100.62 |
| Change (%) | -4.46% | -1.73% | -0.18% | - | +1.28% | +3.48% |
| Change | -47.41 | -18.44 | -1.89 | - | +13.59 | +36.99 |
| Level | Intermediate | Major | Intermediate | - | Minor | Intermediate |
Attention could also be paid to pivot points to set price objectives:
| Pivot points | S3 | S2 | S1 | PP | R1 | R2 | R3 |
|---|---|---|---|---|---|---|---|
| Standard | 1,011.40 | 1,035.88 | 1,049.76 | 1,074.24 | 1,088.12 | 1,112.60 | 1,126.48 |
| Camarilla | 1,053.08 | 1,056.60 | 1,060.11 | 1,063.63 | 1,067.15 | 1,070.66 | 1,074.18 |
| Woodie | 1,006.09 | 1,033.23 | 1,044.45 | 1,071.59 | 1,082.81 | 1,109.95 | 1,121.17 |
| Fibonacci | 1,035.88 | 1,050.54 | 1,059.59 | 1,074.24 | 1,088.90 | 1,097.95 | 1,112.60 |
| Pivot points | S3 | S2 | S1 | PP | R1 | R2 | R3 |
|---|---|---|---|---|---|---|---|
| Standard | 1,008.97 | 1,034.16 | 1,059.71 | 1,084.90 | 1,110.45 | 1,135.64 | 1,161.19 |
| Camarilla | 1,071.31 | 1,075.96 | 1,080.61 | 1,085.26 | 1,089.91 | 1,094.56 | 1,099.21 |
| Woodie | 1,009.15 | 1,034.25 | 1,059.89 | 1,084.99 | 1,110.63 | 1,135.73 | 1,161.37 |
| Fibonacci | 1,034.16 | 1,053.54 | 1,065.52 | 1,084.90 | 1,104.28 | 1,116.26 | 1,135.64 |
| Pivot points | S3 | S2 | S1 | PP | R1 | R2 | R3 |
|---|---|---|---|---|---|---|---|
| Standard | 817.19 | 880.10 | 951.41 | 1,014.32 | 1,085.63 | 1,148.54 | 1,219.85 |
| Camarilla | 985.82 | 998.12 | 1,010.43 | 1,022.73 | 1,035.03 | 1,047.34 | 1,059.64 |
| Woodie | 821.40 | 882.20 | 955.62 | 1,016.42 | 1,089.84 | 1,150.64 | 1,224.06 |
| Fibonacci | 880.10 | 931.37 | 963.05 | 1,014.32 | 1,065.59 | 1,097.27 | 1,148.54 |
Numerical data
The following are the details of the technical indicators and moving averages that were collected to generate this technical analysis:
| RSI (14): | 42.18 | |
| MACD (12,26,9): | -1.8800 | |
| Directional Movement: | -9.07 | |
| AROON (14): | -85.71 | |
| DEMA (21): | 1,076.62 | |
| Parabolic SAR (0,02-0,02-0,2): | 1,096.13 | |
| Elder Ray (13): | -10.79 | |
| Super Trend (3,10): | 1,096.66 | |
| Zig ZAG (10): | 1,063.63 | |
| VORTEX (21): | 0.8600 | |
| Stochastique (14,3,5): | 10.00 | |
| TEMA (21): | 1,070.95 | |
| Williams %R (14): | -91.90 | |
| Chande Momentum Oscillator (20): | -33.49 | |
| Repulse (5,40,3): | -0.8800 | |
| ROCnROLL: | 2 | |
| TRIX (15,9): | 0.0200 | |
| Courbe Coppock: | 0.47 |
| MA7: | 1,074.60 | |
| MA20: | 1,049.84 | |
| MA50: | 995.10 | |
| MA100: | 972.69 | |
| MAexp7: | 1,071.66 | |
| MAexp20: | 1,077.38 | |
| MAexp50: | 1,072.66 | |
| MAexp100: | 1,059.92 | |
| Price / MA7: | -1.02% | |
| Price / MA20: | +1.31% | |
| Price / MA50: | +6.89% | |
| Price / MA100: | +9.35% | |
| Price / MAexp7: | -0.75% | |
| Price / MAexp20: | -1.28% | |
| Price / MAexp50: | -0.84% | |
| Price / MAexp100: | +0.35% |
About author

Online


Add a comment
Comments
0 comments on the analysis ASML HOLDING N.V. NEW YORK REGISTRY SHA - 1H