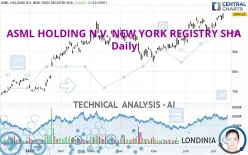
ASML HOLDING N.V. NEW YORK REGISTRY SHA - Daily - Technical analysis published on 07/10/2024 (GMT)
- 184
- 0
Click here for a new analysis!
- Timeframe : Daily
- - Analysis generated on
- Status : INVALID

Summary of the analysis

Additional analysis
Quotes
The ASML HOLDING N.V. NEW YORK REGISTRY SHA price is 1,092.22 USD. The price registered an increase of +3.04% on the session with the lowest point at 1,065.00 USD and the highest point at 1,094.99 USD. The deviation from the price is +2.56% for the low point and -0.25% for the high point.The Central Gaps scanner detects a bullish opening marking the presence of buyers ahead of sellers at the opening but not sufficiently marked to allow the price to register a quotation gap.
Bullish opening
Type : Bullish
Timeframe : Openning
A study of price movements over other periods shows the following variations:
New HIGH record (5 years)
Type : Bullish
Timeframe : Weekly
New HIGH record (1 year)
Type : Bullish
Timeframe : Weekly
New HIGH record (1st january)
Type : Bullish
Timeframe : Weekly
New HIGH record (1 month)
Type : Bullish
Timeframe : Weekly
Technical
Technical analysis of this Daily chart of ASML HOLDING N.V. NEW YORK REGISTRY SHA indicates that the overall trend is strongly bullish. The signals given by the moving averages are 92.86% bullish. This strong bullish trend is confirmed by the strong signals currently being given by short-term moving averages. The Central Indicators market scanner currently does not detect any result that concerns moving averages.
In fact, according to the parameters integrated into the Central Analyzer system, 14 technical indicators out of 18 analysed are currently bullish. Caution: the Central Indicators scanner currently detects an excess:
CCI indicator is overbought : over 100
Type : Neutral
Timeframe : Daily
Williams %R indicator is overbought : over -20
Type : Neutral
Timeframe : Daily
Pivot points : price is over resistance 2
Type : Neutral
Timeframe : Daily
Central Patterns, the market scanner focusing on chart patterns, resistances and supports found this result:
Near horizontal support
Type : Bullish
Timeframe : Daily
The Central Candlesticks scanner which studies Japanese candlesticks did not detect anything.
| S3 | S2 | S1 | Price | |
|---|---|---|---|---|
| ProTrendLines | 694.41 | 870.08 | 1,045.19 | 1,092.22 |
| Change (%) | -36.42% | -20.34% | -4.31% | - |
| Change | -397.81 | -222.14 | -47.03 | - |
| Level | Major | Major | Major | - |
Pivot points can also be used to set your price objectives. Here is the price situation in relation to pivot points:
| Pivot points | S3 | S2 | S1 | PP | R1 | R2 | R3 |
|---|---|---|---|---|---|---|---|
| Standard | 1,030.20 | 1,044.78 | 1,052.37 | 1,066.95 | 1,074.54 | 1,089.12 | 1,096.71 |
| Camarilla | 1,053.87 | 1,055.91 | 1,057.94 | 1,059.97 | 1,062.00 | 1,064.04 | 1,066.07 |
| Woodie | 1,026.72 | 1,043.03 | 1,048.89 | 1,065.20 | 1,071.06 | 1,087.37 | 1,093.23 |
| Fibonacci | 1,044.78 | 1,053.25 | 1,058.48 | 1,066.95 | 1,075.42 | 1,080.65 | 1,089.12 |
| Pivot points | S3 | S2 | S1 | PP | R1 | R2 | R3 |
|---|---|---|---|---|---|---|---|
| Standard | 965.60 | 990.70 | 1,032.59 | 1,057.69 | 1,099.58 | 1,124.68 | 1,166.57 |
| Camarilla | 1,056.06 | 1,062.20 | 1,068.34 | 1,074.48 | 1,080.62 | 1,086.76 | 1,092.90 |
| Woodie | 974.00 | 994.90 | 1,040.99 | 1,061.89 | 1,107.98 | 1,128.88 | 1,174.97 |
| Fibonacci | 990.70 | 1,016.29 | 1,032.10 | 1,057.69 | 1,083.28 | 1,099.09 | 1,124.68 |
| Pivot points | S3 | S2 | S1 | PP | R1 | R2 | R3 |
|---|---|---|---|---|---|---|---|
| Standard | 817.19 | 880.10 | 951.41 | 1,014.32 | 1,085.63 | 1,148.54 | 1,219.85 |
| Camarilla | 985.82 | 998.12 | 1,010.43 | 1,022.73 | 1,035.03 | 1,047.34 | 1,059.64 |
| Woodie | 821.40 | 882.20 | 955.62 | 1,016.42 | 1,089.84 | 1,150.64 | 1,224.06 |
| Fibonacci | 880.10 | 931.37 | 963.05 | 1,014.32 | 1,065.59 | 1,097.27 | 1,148.54 |
Numerical data
The following are the details of the technical indicators and moving averages that were collected to generate this technical analysis:
| RSI (14): | 64.26 | |
| MACD (12,26,9): | 23.2700 | |
| Directional Movement: | 13.65 | |
| AROON (14): | 78.57 | |
| DEMA (21): | 1,073.84 | |
| Parabolic SAR (0,02-0,02-0,2): | 1,016.08 | |
| Elder Ray (13): | 25.24 | |
| Super Trend (3,10): | 1,008.06 | |
| Zig ZAG (10): | 1,094.86 | |
| VORTEX (21): | 0.9500 | |
| Stochastique (14,3,5): | 85.10 | |
| TEMA (21): | 1,077.64 | |
| Williams %R (14): | -0.14 | |
| Chande Momentum Oscillator (20): | 58.26 | |
| Repulse (5,40,3): | 1.6000 | |
| ROCnROLL: | 1 | |
| TRIX (15,9): | 0.3200 | |
| Courbe Coppock: | 4.04 |
| MA7: | 1,065.42 | |
| MA20: | 1,046.93 | |
| MA50: | 983.48 | |
| MA100: | 968.16 | |
| MAexp7: | 1,066.80 | |
| MAexp20: | 1,042.82 | |
| MAexp50: | 1,003.14 | |
| MAexp100: | 954.10 | |
| Price / MA7: | +2.52% | |
| Price / MA20: | +4.33% | |
| Price / MA50: | +11.06% | |
| Price / MA100: | +12.81% | |
| Price / MAexp7: | +2.38% | |
| Price / MAexp20: | +4.74% | |
| Price / MAexp50: | +8.88% | |
| Price / MAexp100: | +14.48% |
About author
Online


Add a comment
Comments
0 comments on the analysis ASML HOLDING N.V. NEW YORK REGISTRY SHA - Daily