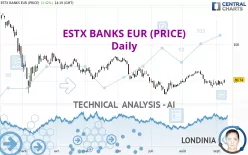
ESTX BANKS EUR (PRICE) - Daily - Technical analysis published on 09/08/2022 (GMT)
- 158
- 0
- Timeframe : Daily
- - Analysis generated on
- Status : NEUTRAL

Summary of the analysis

Additional analysis
Quotes
ESTX BANKS EUR (PRICE) rating 80.74 EUR. The price has increased by +2.42% since the last closing and was traded between 79.06 EUR and 80.78 EUR over the period. The price is currently at +2.12% from its lowest and -0.05% from its highest.A bullish gap was detected at the opening by the Central Gaps scanner. There are a lot of buyers and they have the upper hand in the very short term.
Opening Gap UP
Type : Bullish
Timeframe : Openning
So that you have an overall view of the price change, here is a table showing the variations over several periods:
Near a new LOW record (1 month)
Type : Bearish
Timeframe : Weekly
Technical
Technical analysis of this Daily chart of ESTX BANKS EUR (PRICE) indicates that the overall trend is slightly bearish. Only 60.71% of the signals given by moving averages are bearish. This slightly bearish trend could turn neutral or reverse given the slightly bullish signals currently being given by short-term moving averages. The Central Indicators market scanner is currently detecting several bullish signals that could impact this trend:
Bullish price crossover with Moving Average 20
Type : Bullish
Timeframe : Daily
Bullish price crossover with Moving Average 50
Type : Bullish
Timeframe : Daily
In fact, only 9 technical indicators out of 18 studied are currently positioned bullish. Caution: the Central Indicators scanner currently detects an excess:
MACD indicator: bullish divergence
Type : Bullish
Timeframe : Daily
Williams %R indicator is overbought : over -20
Type : Neutral
Timeframe : Daily
Pivot points : price is over resistance 2
Type : Neutral
Timeframe : Daily
RSI indicator is back over 50
Type : Bullish
Timeframe : Daily
Parabolic SAR indicator bullish reversal
Type : Bullish
Timeframe : Daily
Momentum indicator is back over 0
Type : Bullish
Timeframe : Daily
Central Patterns, the scanner specializing in chart patterns, did not identify any signals.
The Central Candlesticks scanner, specialised in Japanese candlesticks, did not identify any signals.
| S3 | S2 | S1 | Price | R1 | R2 | R3 | |
|---|---|---|---|---|---|---|---|
| ProTrendLines | 67.24 | 73.04 | 78.05 | 80.74 | 85.91 | 93.36 | 103.60 |
| Change (%) | -16.72% | -9.54% | -3.33% | - | +6.40% | +15.63% | +28.31% |
| Change | -13.50 | -7.70 | -2.69 | - | +5.17 | +12.62 | +22.86 |
| Level | Minor | Minor | Major | - | Intermediate | Intermediate | Major |
Pivot points can also be used to set your price objectives. Here is the price situation in relation to pivot points:
| Pivot points | S3 | S2 | S1 | PP | R1 | R2 | R3 |
|---|---|---|---|---|---|---|---|
| Standard | 76.45 | 77.02 | 77.92 | 78.49 | 79.39 | 79.96 | 80.86 |
| Camarilla | 78.43 | 78.56 | 78.70 | 78.83 | 78.97 | 79.10 | 79.23 |
| Woodie | 76.63 | 77.10 | 78.10 | 78.57 | 79.57 | 80.04 | 81.04 |
| Fibonacci | 77.02 | 77.58 | 77.93 | 78.49 | 79.05 | 79.40 | 79.96 |
| Pivot points | S3 | S2 | S1 | PP | R1 | R2 | R3 |
|---|---|---|---|---|---|---|---|
| Standard | 73.55 | 75.04 | 77.67 | 79.16 | 81.79 | 83.28 | 85.91 |
| Camarilla | 79.16 | 79.54 | 79.91 | 80.29 | 80.67 | 81.05 | 81.42 |
| Woodie | 74.11 | 75.33 | 78.23 | 79.45 | 82.35 | 83.57 | 86.47 |
| Fibonacci | 75.04 | 76.62 | 77.59 | 79.16 | 80.74 | 81.71 | 83.28 |
| Pivot points | S3 | S2 | S1 | PP | R1 | R2 | R3 |
|---|---|---|---|---|---|---|---|
| Standard | 65.95 | 71.24 | 75.18 | 80.47 | 84.41 | 89.70 | 93.64 |
| Camarilla | 76.57 | 77.42 | 78.26 | 79.11 | 79.96 | 80.80 | 81.65 |
| Woodie | 65.27 | 70.90 | 74.50 | 80.13 | 83.73 | 89.36 | 92.96 |
| Fibonacci | 71.24 | 74.77 | 76.95 | 80.47 | 84.00 | 86.18 | 89.70 |
Numerical data
The following is the status of technical indicators and moving averages registered at the time this technical analysis was created:
| RSI (14): | 51.16 | |
| MACD (12,26,9): | -0.5000 | |
| Directional Movement: | 0.96 | |
| AROON (14): | -42.86 | |
| DEMA (21): | 79.26 | |
| Parabolic SAR (0,02-0,02-0,2): | 76.54 | |
| Elder Ray (13): | 0.33 | |
| Super Trend (3,10): | 82.38 | |
| Zig ZAG (10): | 80.53 | |
| VORTEX (21): | 0.8700 | |
| Stochastique (14,3,5): | 52.72 | |
| TEMA (21): | 79.09 | |
| Williams %R (14): | -6.01 | |
| Chande Momentum Oscillator (20): | 1.04 | |
| Repulse (5,40,3): | 3.3200 | |
| ROCnROLL: | -1 | |
| TRIX (15,9): | -0.0700 | |
| Courbe Coppock: | 7.94 |
| MA7: | 79.21 | |
| MA20: | 80.48 | |
| MA50: | 79.49 | |
| MA100: | 82.97 | |
| MAexp7: | 79.41 | |
| MAexp20: | 79.83 | |
| MAexp50: | 80.84 | |
| MAexp100: | 83.47 | |
| Price / MA7: | +1.93% | |
| Price / MA20: | +0.32% | |
| Price / MA50: | +1.57% | |
| Price / MA100: | -2.69% | |
| Price / MAexp7: | +1.67% | |
| Price / MAexp20: | +1.14% | |
| Price / MAexp50: | -0.12% | |
| Price / MAexp100: | -3.27% |
About author
Online


Add a comment
Comments
0 comments on the analysis ESTX BANKS EUR (PRICE) - Daily