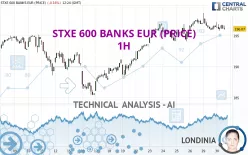
STXE 600 BANKS EUR (PRICE) - 1H - Technical analysis published on 04/30/2024 (GMT)
- 145
- 0
Click here for a new analysis!
- Timeframe : 1H
- - Analysis generated on
- Status : LEVEL MAINTAINED

Summary of the analysis

Additional analysis
Quotes
The STXE 600 BANKS EUR (PRICE) price is 196.36 EUR. The price registered a decrease of -0.01% on the session and was between 195.79 EUR and 197.15 EUR. This implies that the price is at +0.29% from its lowest and at -0.40% from its highest.A bearish opening was detected by the Central Gaps scanner. Sellers are trying to impose a bearish trend in the very short term.
Bearish opening
Type : Bearish
Timeframe : Openning
Here is a more detailed summary of the historical variations registered by STXE 600 BANKS EUR (PRICE):
New HIGH record (5 years)
Type : Bullish
Timeframe : Weekly
Near a new HIGH record (1 year)
Type : Bullish
Timeframe : Weekly
Near a new HIGH record (1st january)
Type : Bullish
Timeframe : Weekly
Near a new HIGH record (1 month)
Type : Bullish
Timeframe : Weekly
Technical
Technical analysis of this 1H chart of STXE 600 BANKS EUR (PRICE) indicates that the overall trend is bullish. 71.43% of the signals given by moving averages are bullish. Caution: the neutral signals currently given by short-term moving averages show us that the global trend is losing momentum. The Central Indicators market scanner is currently detecting several bearish signals that could impact this trend:
Bearish price crossover with adaptative moving average 20
Type : Bearish
Timeframe : 1 hour
Bearish price crossover with adaptative moving average 50
Type : Bearish
Timeframe : 1 hour
On the 18 technical indicators analysed, 5 are bullish, 8 are neutral and 5 are bearish. Caution: the Central Indicators scanner currently detects an excess:
Williams %R indicator is oversold : under -80
Type : Neutral
Timeframe : 1 hour
The analysis of the price chart with Central Patterns scanners does not return any result.
The Central Candlesticks scanner which studies Japanese candlesticks did not detect anything.
| S3 | S2 | S1 | Price | R1 | R2 | R3 | |
|---|---|---|---|---|---|---|---|
| ProTrendLines | 188.59 | 192.47 | 195.09 | 196.36 | 196.68 | 198.62 | 227.10 |
| Change (%) | -3.96% | -1.98% | -0.65% | - | +0.16% | +1.15% | +15.65% |
| Change | -7.77 | -3.89 | -1.27 | - | +0.32 | +2.26 | +30.74 |
| Level | Minor | Minor | Intermediate | - | Major | Intermediate | Major |
Attention could also be paid to pivot points to set price objectives:
| Pivot points | S3 | S2 | S1 | PP | R1 | R2 | R3 |
|---|---|---|---|---|---|---|---|
| Standard | 192.53 | 194.19 | 195.29 | 196.95 | 198.05 | 199.71 | 200.81 |
| Camarilla | 195.62 | 195.87 | 196.13 | 196.38 | 196.63 | 196.89 | 197.14 |
| Woodie | 192.24 | 194.05 | 195.00 | 196.81 | 197.76 | 199.57 | 200.52 |
| Fibonacci | 194.19 | 195.25 | 195.90 | 196.95 | 198.01 | 198.66 | 199.71 |
| Pivot points | S3 | S2 | S1 | PP | R1 | R2 | R3 |
|---|---|---|---|---|---|---|---|
| Standard | 186.11 | 188.56 | 192.80 | 195.25 | 199.49 | 201.94 | 206.18 |
| Camarilla | 195.20 | 195.81 | 196.43 | 197.04 | 197.65 | 198.27 | 198.88 |
| Woodie | 187.01 | 189.01 | 193.70 | 195.70 | 200.39 | 202.39 | 207.08 |
| Fibonacci | 188.56 | 191.12 | 192.69 | 195.25 | 197.81 | 199.38 | 201.94 |
| Pivot points | S3 | S2 | S1 | PP | R1 | R2 | R3 |
|---|---|---|---|---|---|---|---|
| Standard | 163.85 | 169.31 | 179.74 | 185.20 | 195.63 | 201.09 | 211.52 |
| Camarilla | 185.80 | 187.26 | 188.71 | 190.17 | 191.63 | 193.08 | 194.54 |
| Woodie | 166.34 | 170.55 | 182.23 | 186.44 | 198.12 | 202.33 | 214.01 |
| Fibonacci | 169.31 | 175.38 | 179.13 | 185.20 | 191.27 | 195.02 | 201.09 |
Numerical data
The following is the status of technical indicators and moving averages registered at the time this technical analysis was created:
| RSI (14): | 49.97 | |
| MACD (12,26,9): | 0.1300 | |
| Directional Movement: | 11.00 | |
| AROON (14): | -78.57 | |
| DEMA (21): | 196.60 | |
| Parabolic SAR (0,02-0,02-0,2): | 197.37 | |
| Elder Ray (13): | 0.03 | |
| Super Trend (3,10): | 195.52 | |
| Zig ZAG (10): | 196.13 | |
| VORTEX (21): | 0.9800 | |
| Stochastique (14,3,5): | 17.90 | |
| TEMA (21): | 196.22 | |
| Williams %R (14): | -83.39 | |
| Chande Momentum Oscillator (20): | -0.70 | |
| Repulse (5,40,3): | -0.1700 | |
| ROCnROLL: | -1 | |
| TRIX (15,9): | 0.0200 | |
| Courbe Coppock: | 0.79 |
| MA7: | 195.71 | |
| MA20: | 192.98 | |
| MA50: | 185.21 | |
| MA100: | 176.66 | |
| MAexp7: | 196.32 | |
| MAexp20: | 196.36 | |
| MAexp50: | 195.51 | |
| MAexp100: | 194.10 | |
| Price / MA7: | +0.33% | |
| Price / MA20: | +1.75% | |
| Price / MA50: | +6.02% | |
| Price / MA100: | +11.15% | |
| Price / MAexp7: | +0.02% | |
| Price / MAexp20: | -0% | |
| Price / MAexp50: | +0.43% | |
| Price / MAexp100: | +1.16% |
About author
Online


Add a comment
Comments
0 comments on the analysis STXE 600 BANKS EUR (PRICE) - 1H