STXE 600 BANKS EUR (PRICE) - 1H - Technical analysis published on 11/22/2024 (GMT)
- 114
- 0
Click here for a new analysis!
- Timeframe : 1H
- - Analysis generated on
- Status : TARGET REACHED

Summary of the analysis

Additional analysis
Quotes
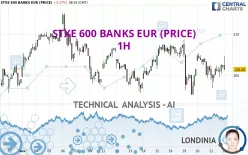
STXE 600 BANKS EUR (PRICE) rating 205.69 EUR. On the day, this instrument lost -0.17% and was traded between 205.62 EUR and 207.34 EUR over the period. The price is currently at +0.03% from its lowest and -0.80% from its highest.The Central Gaps scanner detects a bullish opening. A small advantage for buyers in the very short term.
Bullish opening
Type : Bullish
Timeframe : Openning
So that you have an overall view of the price change, here is a table showing the variations over several periods:
Near a new HIGH record (5 years)
Type : Bullish
Timeframe : Weekly
Near a new HIGH record (1 year)
Type : Bullish
Timeframe : Weekly
Near a new HIGH record (1st january)
Type : Bullish
Timeframe : Weekly
Near a new HIGH record (1 month)
Type : Bullish
Timeframe : Weekly
Technical
Technical analysis of STXE 600 BANKS EUR (PRICE) in 1H shows an overall slightly bearish trend. 57.14% of the signals given by moving averages are bearish. This bearish trend does not seem to be increasing given the slightly bearish signals given by short-term moving averages. An assessment of moving averages reveals several bullish signals that could impact this trend:
Bullish price crossover with Moving Average 100
Type : Bullish
Timeframe : 1 hour
Bullish price crossover with adaptative moving average 20
Type : Bullish
Timeframe : 1 hour
The technical indicators are bullish. There is still some doubt about the price increase.
Other results related to technical indicators were also found by the Central Indicators scanner:
RSI indicator is back under 50
Type : Bearish
Timeframe : 1 hour
Aroon indicator bullish trend
Type : Bullish
Timeframe : 1 hour
Ichimoku : price is over the cloud
Type : Bullish
Timeframe : 1 hour
Price is back under the pivot point
Type : Bearish
Timeframe : Weekly
Momentum indicator is back over 0
Type : Bullish
Timeframe : 1 hour
No signals are given by Central Patterns, a market scanner specialised in chart patterns, resistances and supports.
The Central Candlesticks scanner which studies Japanese candlesticks did not detect anything.
| S3 | S2 | S1 | Price | R1 | R2 | R3 | |
|---|---|---|---|---|---|---|---|
| ProTrendLines | 190.82 | 196.68 | 202.83 | 205.69 | 205.76 | 207.73 | 209.33 |
| Change (%) | -7.23% | -4.38% | -1.39% | - | +0.03% | +0.99% | +1.77% |
| Change | -14.87 | -9.01 | -2.86 | - | +0.07 | +2.04 | +3.64 |
| Level | Minor | Intermediate | Major | - | Major | Intermediate | Intermediate |
Attention could also be paid to pivot points to set price objectives:
| Pivot points | S3 | S2 | S1 | PP | R1 | R2 | R3 |
|---|---|---|---|---|---|---|---|
| Standard | 201.16 | 202.29 | 204.17 | 205.30 | 207.18 | 208.31 | 210.19 |
| Camarilla | 205.21 | 205.49 | 205.76 | 206.04 | 206.32 | 206.59 | 206.87 |
| Woodie | 201.53 | 202.48 | 204.54 | 205.49 | 207.55 | 208.50 | 210.56 |
| Fibonacci | 202.29 | 203.44 | 204.15 | 205.30 | 206.45 | 207.16 | 208.31 |
| Pivot points | S3 | S2 | S1 | PP | R1 | R2 | R3 |
|---|---|---|---|---|---|---|---|
| Standard | 198.42 | 200.63 | 204.41 | 206.62 | 210.40 | 212.61 | 216.39 |
| Camarilla | 206.55 | 207.10 | 207.65 | 208.20 | 208.75 | 209.30 | 209.85 |
| Woodie | 199.22 | 201.02 | 205.21 | 207.01 | 211.20 | 213.00 | 217.19 |
| Fibonacci | 200.63 | 202.92 | 204.33 | 206.62 | 208.91 | 210.32 | 212.61 |
| Pivot points | S3 | S2 | S1 | PP | R1 | R2 | R3 |
|---|---|---|---|---|---|---|---|
| Standard | 185.29 | 190.79 | 197.67 | 203.17 | 210.05 | 215.55 | 222.43 |
| Camarilla | 201.14 | 202.27 | 203.41 | 204.54 | 205.68 | 206.81 | 207.95 |
| Woodie | 185.97 | 191.14 | 198.35 | 203.52 | 210.73 | 215.90 | 223.11 |
| Fibonacci | 190.79 | 195.52 | 198.44 | 203.17 | 207.90 | 210.82 | 215.55 |
Numerical data
The following is the status of technical indicators and moving averages registered at the time this technical analysis was created:
| RSI (14): | 53.17 | |
| MACD (12,26,9): | -0.1000 | |
| Directional Movement: | -2.27 | |
| AROON (14): | 57.14 | |
| DEMA (21): | 205.68 | |
| Parabolic SAR (0,02-0,02-0,2): | 203.07 | |
| Elder Ray (13): | 0.96 | |
| Super Trend (3,10): | 203.74 | |
| Zig ZAG (10): | 206.25 | |
| VORTEX (21): | 1.1100 | |
| Stochastique (14,3,5): | 71.51 | |
| TEMA (21): | 205.67 | |
| Williams %R (14): | -32.99 | |
| Chande Momentum Oscillator (20): | 1.03 | |
| Repulse (5,40,3): | -0.4300 | |
| ROCnROLL: | 2 | |
| TRIX (15,9): | -0.0200 | |
| Courbe Coppock: | 0.65 |
| MA7: | 206.72 | |
| MA20: | 206.71 | |
| MA50: | 204.53 | |
| MA100: | 200.99 | |
| MAexp7: | 205.79 | |
| MAexp20: | 205.89 | |
| MAexp50: | 206.16 | |
| MAexp100: | 206.37 | |
| Price / MA7: | -0.50% | |
| Price / MA20: | -0.49% | |
| Price / MA50: | +0.57% | |
| Price / MA100: | +2.34% | |
| Price / MAexp7: | -0.05% | |
| Price / MAexp20: | -0.10% | |
| Price / MAexp50: | -0.23% | |
| Price / MAexp100: | -0.33% |
About author
Online


Add a comment
Comments
0 comments on the analysis STXE 600 BANKS EUR (PRICE) - 1H