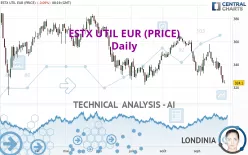
ESTX UTIL EUR (PRICE) - Daily - Technical analysis published on 09/27/2022 (GMT)
- 128
- 0
Click here for a new analysis!
- Timeframe : Daily
- - Analysis generated on
- Status : TARGET REACHED

Summary of the analysis

Additional analysis
Quotes
The ESTX UTIL EUR (PRICE) rating is 324.10 EUR. The price is lower by -0.09% since the last closing with the lowest point at 323.69 EUR and the highest point at 326.35 EUR. The deviation from the price is +0.13% for the low point and -0.69% for the high point.A bearish opening was detected by the Central Gaps scanner. Sellers are trying to impose a bearish trend in the very short term.
Bearish opening
Type : Bearish
Timeframe : Openning
Here is a more detailed summary of the historical variations registered by ESTX UTIL EUR (PRICE):
Near a new LOW record (1 year)
Type : Bearish
Timeframe : Weekly
Near a new LOW record (1st january)
Type : Bearish
Timeframe : Weekly
Near a new LOW record (1 month)
Type : Bearish
Timeframe : Weekly
Technical
Technical analysis of ESTX UTIL EUR (PRICE) in Daily shows a overall strongly bearish trend. The signals given by moving averages are 92.86% bearish. This strong bearish trend is confirmed by the strong signals currently being given by short-term moving averages. The Central Indicators market scanner is currently detecting a bearish signal that could impact this trend:
Bearish trend reversal : Moving Average 50
Type : Bearish
Timeframe : Daily
In fact, of the 18 technical indicators analysed by Central Analyzer, 4 are bullish, 2 are neutral and 12 are bearish. But beware of excesses. The Central Indicators scanner currently detects this:
CCI indicator is oversold : under -100
Type : Neutral
Timeframe : Daily
Previous candle closed under Bollinger bands
Type : Neutral
Timeframe : Daily
CCI indicator: bullish divergence
Type : Bullish
Timeframe : Daily
RSI indicator: bullish divergence
Type : Bullish
Timeframe : Daily
Williams %R indicator is oversold : under -80
Type : Neutral
Timeframe : Daily
The analysis of the price chart with Central Patterns scanners does not return any result.
No result was found by the Central Candlesticks scanner on Japanese candlesticks.
| S3 | S2 | S1 | Price | R1 | R2 | R3 | |
|---|---|---|---|---|---|---|---|
| ProTrendLines | 273.16 | 291.12 | 303.38 | 324.10 | 330.49 | 346.06 | 374.63 |
| Change (%) | -15.72% | -10.18% | -6.39% | - | +1.97% | +6.78% | +15.59% |
| Change | -50.94 | -32.98 | -20.72 | - | +6.39 | +21.96 | +50.53 |
| Level | Major | Minor | Major | - | Major | Major | Major |
Attention could also be paid to pivot points to set price objectives:
| Pivot points | S3 | S2 | S1 | PP | R1 | R2 | R3 |
|---|---|---|---|---|---|---|---|
| Standard | 314.97 | 319.49 | 321.93 | 326.45 | 328.89 | 333.41 | 335.85 |
| Camarilla | 322.47 | 323.10 | 323.74 | 324.38 | 325.02 | 325.66 | 326.29 |
| Woodie | 313.94 | 318.97 | 320.90 | 325.93 | 327.86 | 332.89 | 334.82 |
| Fibonacci | 319.49 | 322.15 | 323.79 | 326.45 | 329.11 | 330.75 | 333.41 |
| Pivot points | S3 | S2 | S1 | PP | R1 | R2 | R3 |
|---|---|---|---|---|---|---|---|
| Standard | 306.01 | 317.00 | 324.07 | 335.06 | 342.13 | 353.12 | 360.19 |
| Camarilla | 326.18 | 327.84 | 329.50 | 331.15 | 332.81 | 334.46 | 336.12 |
| Woodie | 304.06 | 316.02 | 322.12 | 334.08 | 340.18 | 352.14 | 358.24 |
| Fibonacci | 317.00 | 323.90 | 328.16 | 335.06 | 341.96 | 346.22 | 353.12 |
| Pivot points | S3 | S2 | S1 | PP | R1 | R2 | R3 |
|---|---|---|---|---|---|---|---|
| Standard | 293.28 | 313.95 | 324.33 | 345.00 | 355.38 | 376.05 | 386.43 |
| Camarilla | 326.18 | 329.03 | 331.87 | 334.72 | 337.57 | 340.41 | 343.26 |
| Woodie | 288.15 | 311.38 | 319.20 | 342.43 | 350.25 | 373.48 | 381.30 |
| Fibonacci | 313.95 | 325.81 | 333.14 | 345.00 | 356.86 | 364.19 | 376.05 |
Numerical data
The following is the status of the technical indicators and moving averages at the time of publication of this technical analysis:
| RSI (14): | 33.30 | |
| MACD (12,26,9): | -4.7000 | |
| Directional Movement: | -13.70 | |
| AROON (14): | -64.29 | |
| DEMA (21): | 334.11 | |
| Parabolic SAR (0,02-0,02-0,2): | 349.12 | |
| Elder Ray (13): | -11.38 | |
| Super Trend (3,10): | 344.82 | |
| Zig ZAG (10): | 325.31 | |
| VORTEX (21): | 0.8600 | |
| Stochastique (14,3,5): | 5.42 | |
| TEMA (21): | 330.30 | |
| Williams %R (14): | -96.59 | |
| Chande Momentum Oscillator (20): | -21.51 | |
| Repulse (5,40,3): | -2.9600 | |
| ROCnROLL: | 2 | |
| TRIX (15,9): | -0.1200 | |
| Courbe Coppock: | 4.39 |
| MA7: | 334.16 | |
| MA20: | 339.41 | |
| MA50: | 345.85 | |
| MA100: | 349.23 | |
| MAexp7: | 332.53 | |
| MAexp20: | 339.46 | |
| MAexp50: | 344.11 | |
| MAexp100: | 348.89 | |
| Price / MA7: | -3.01% | |
| Price / MA20: | -4.51% | |
| Price / MA50: | -6.29% | |
| Price / MA100: | -7.20% | |
| Price / MAexp7: | -2.54% | |
| Price / MAexp20: | -4.52% | |
| Price / MAexp50: | -5.82% | |
| Price / MAexp100: | -7.11% |
About author
Online


Add a comment
Comments
0 comments on the analysis ESTX UTIL EUR (PRICE) - Daily