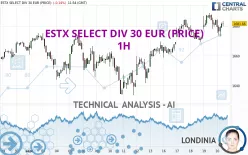
ESTX SELECT DIV 30 EUR (PRICE) - 1H - Technical analysis published on 09/20/2024 (GMT)
- 157
- 0
Click here for a new analysis!
- Timeframe : 1H
- - Analysis generated on
- Status : INVALID

Summary of the analysis

Additional analysis
Quotes
The ESTX SELECT DIV 30 EUR (PRICE) price is 1,681.66 EUR. On the day, this instrument lost -0.14% and was between 1,673.35 EUR and 1,684.59 EUR. This implies that the price is at +0.50% from its lowest and at -0.17% from its highest.A bearish opening was detected by the Central Gaps scanner. Sellers are trying to impose a bearish trend in the very short term.
Bearish opening
Type : Bearish
Timeframe : Openning
Here is a more detailed summary of the historical variations registered by ESTX SELECT DIV 30 EUR (PRICE):
Near a new HIGH record (1 year)
Type : Bullish
Timeframe : Weekly
Near a new HIGH record (1st january)
Type : Bullish
Timeframe : Weekly
Near a new LOW record (1 month)
Type : Bearish
Timeframe : Weekly
Technical
A technical analysis in 1H of this ESTX SELECT DIV 30 EUR (PRICE) chart shows a strongly bullish trend. The signals given by the moving averages are 92.86% bullish. This strong bullish trend is confirmed by the strong signals currently being given by short-term moving averages. The Central Indicators scanner does not detect any result on moving averages that would impact this trend.
An assessment of technical indicators shows a moderate bullish signal.
Central Indicators, the detector scanner for these technical indicators recently detected a signal:
Pivot points : price is over resistance 1
Type : Neutral
Timeframe : Weekly
Central Patterns, the scanner specializing in chart patterns, did not identify any signals.
There is also a Japanese candlestick pattern detected by Central Candlesticks that could mark the end of the current short-term trend:
White gravestone / inverted hammer
Type : Neutral
Timeframe : 1 hour
| S3 | S2 | S1 | Price | R1 | R2 | R3 | |
|---|---|---|---|---|---|---|---|
| ProTrendLines | 1,660.87 | 1,669.31 | 1,675.25 | 1,681.66 | 1,684.36 | 1,699.08 | 1,733.96 |
| Change (%) | -1.24% | -0.73% | -0.38% | - | +0.16% | +1.04% | +3.11% |
| Change | -20.79 | -12.35 | -6.41 | - | +2.70 | +17.42 | +52.30 |
| Level | Minor | Intermediate | Intermediate | - | Intermediate | Minor | Intermediate |
To determine price objectives, it is also possible to use the pivot points. Here is the price position in relation to pivot points:
| Pivot points | S3 | S2 | S1 | PP | R1 | R2 | R3 |
|---|---|---|---|---|---|---|---|
| Standard | 1,667.52 | 1,672.68 | 1,678.35 | 1,683.51 | 1,689.18 | 1,694.34 | 1,700.01 |
| Camarilla | 1,681.04 | 1,682.04 | 1,683.03 | 1,684.02 | 1,685.01 | 1,686.01 | 1,687.00 |
| Woodie | 1,667.78 | 1,672.81 | 1,678.61 | 1,683.64 | 1,689.44 | 1,694.47 | 1,700.27 |
| Fibonacci | 1,672.68 | 1,676.82 | 1,679.37 | 1,683.51 | 1,687.65 | 1,690.20 | 1,694.34 |
| Pivot points | S3 | S2 | S1 | PP | R1 | R2 | R3 |
|---|---|---|---|---|---|---|---|
| Standard | 1,605.60 | 1,619.62 | 1,641.47 | 1,655.49 | 1,677.34 | 1,691.36 | 1,713.21 |
| Camarilla | 1,653.46 | 1,656.74 | 1,660.03 | 1,663.32 | 1,666.61 | 1,669.90 | 1,673.18 |
| Woodie | 1,609.52 | 1,621.58 | 1,645.39 | 1,657.45 | 1,681.26 | 1,693.32 | 1,717.13 |
| Fibonacci | 1,619.62 | 1,633.32 | 1,641.79 | 1,655.49 | 1,669.19 | 1,677.66 | 1,691.36 |
| Pivot points | S3 | S2 | S1 | PP | R1 | R2 | R3 |
|---|---|---|---|---|---|---|---|
| Standard | 1,435.13 | 1,482.77 | 1,574.37 | 1,622.01 | 1,713.61 | 1,761.25 | 1,852.85 |
| Camarilla | 1,627.68 | 1,640.44 | 1,653.21 | 1,665.97 | 1,678.73 | 1,691.50 | 1,704.26 |
| Woodie | 1,457.11 | 1,493.76 | 1,596.35 | 1,633.00 | 1,735.59 | 1,772.24 | 1,874.83 |
| Fibonacci | 1,482.77 | 1,535.96 | 1,568.82 | 1,622.01 | 1,675.20 | 1,708.06 | 1,761.25 |
Numerical data
The following is the status of the technical indicators and moving averages at the time of publication of this technical analysis:
| RSI (14): | 57.84 | |
| MACD (12,26,9): | 2.3600 | |
| Directional Movement: | 2.96 | |
| AROON (14): | 35.71 | |
| DEMA (21): | 1,683.12 | |
| Parabolic SAR (0,02-0,02-0,2): | 1,686.12 | |
| Elder Ray (13): | 1.76 | |
| Super Trend (3,10): | 1,673.78 | |
| Zig ZAG (10): | 1,683.00 | |
| VORTEX (21): | 1.0200 | |
| Stochastique (14,3,5): | 54.91 | |
| TEMA (21): | 1,681.71 | |
| Williams %R (14): | -44.71 | |
| Chande Momentum Oscillator (20): | 0.06 | |
| Repulse (5,40,3): | 0.1600 | |
| ROCnROLL: | 1 | |
| TRIX (15,9): | 0.0200 | |
| Courbe Coppock: | 0.67 |
| MA7: | 1,671.37 | |
| MA20: | 1,660.89 | |
| MA50: | 1,640.73 | |
| MA100: | 1,653.54 | |
| MAexp7: | 1,680.84 | |
| MAexp20: | 1,679.57 | |
| MAexp50: | 1,673.64 | |
| MAexp100: | 1,666.62 | |
| Price / MA7: | +0.62% | |
| Price / MA20: | +1.25% | |
| Price / MA50: | +2.49% | |
| Price / MA100: | +1.70% | |
| Price / MAexp7: | +0.05% | |
| Price / MAexp20: | +0.12% | |
| Price / MAexp50: | +0.48% | |
| Price / MAexp100: | +0.90% |
About author
Online


Add a comment
Comments
0 comments on the analysis ESTX SELECT DIV 30 EUR (PRICE) - 1H