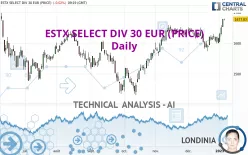
ESTX SELECT DIV 30 EUR (PRICE) - Daily - Technical analysis published on 01/05/2023 (GMT)
- 207
- 0
Click here for a new analysis!
- Timeframe : Daily
- - Analysis generated on
- Status : TARGET REACHED

Summary of the analysis

Additional analysis
Quotes
ESTX SELECT DIV 30 EUR (PRICE) rating 1,677.83 EUR. The price is lower by -0.02% since the last closing and was between 1,674.06 EUR and 1,679.45 EUR. This implies that the price is at +0.23% from its lowest and at -0.10% from its highest.The Central Gaps scanner detects a bearish opening. A small advantage for sellers in the very short term.
Bearish opening
Type : Bearish
Timeframe : Openning
Here is a more detailed summary of the historical variations registered by ESTX SELECT DIV 30 EUR (PRICE):
New HIGH record (1st january)
Type : Bullish
Timeframe : Weekly
New HIGH record (1 month)
Type : Bullish
Timeframe : Weekly
Technical
A technical analysis in Daily of this ESTX SELECT DIV 30 EUR (PRICE) chart shows a strongly bullish trend. The signals given by the moving averages are 92.86% bullish. This strong bullish trend is confirmed by the strong signals currently being given by short-term moving averages. The Central Indicators scanner does not detect any result on moving averages that would impact this trend.
In fact, according to the parameters integrated into the Central Analyzer system, 16 technical indicators out of 18 analysed are currently bullish. Caution: the Central Indicators scanner currently detects an excess:
CCI indicator is overbought : over 100
Type : Neutral
Timeframe : Daily
Previous candle closed over Bollinger bands
Type : Neutral
Timeframe : Daily
Williams %R indicator is overbought : over -20
Type : Neutral
Timeframe : Daily
Pivot points : price is over resistance 3
Type : Neutral
Timeframe : Weekly
Central Patterns, the scanner specializing in chart patterns, did not identify any signals.
The presence of these bearish patterns in Japanese candlesticks detected by Central Candlesticks that could cause a correction in the very short term were also noted
Bearish harami
Type : Bearish
Timeframe : Daily
Bearish harami cross
Type : Bearish
Timeframe : Daily
| S3 | S2 | S1 | Price | R1 | R2 | R3 | |
|---|---|---|---|---|---|---|---|
| ProTrendLines | 1,520.85 | 1,597.26 | 1,647.58 | 1,677.83 | 1,698.44 | 1,739.54 | 1,797.34 |
| Change (%) | -9.36% | -4.80% | -1.80% | - | +1.23% | +3.68% | +7.12% |
| Change | -156.98 | -80.57 | -30.25 | - | +20.61 | +61.71 | +119.51 |
| Level | Minor | Major | Major | - | Minor | Major | Minor |
Attention could also be paid to pivot points to set price objectives:
| Pivot points | S3 | S2 | S1 | PP | R1 | R2 | R3 |
|---|---|---|---|---|---|---|---|
| Standard | 1,634.57 | 1,643.67 | 1,660.92 | 1,670.02 | 1,687.27 | 1,696.37 | 1,713.62 |
| Camarilla | 1,670.93 | 1,673.35 | 1,675.77 | 1,678.18 | 1,680.60 | 1,683.01 | 1,685.43 |
| Woodie | 1,638.66 | 1,645.71 | 1,665.01 | 1,672.06 | 1,691.36 | 1,698.41 | 1,717.71 |
| Fibonacci | 1,643.67 | 1,653.73 | 1,659.95 | 1,670.02 | 1,680.08 | 1,686.30 | 1,696.37 |
| Pivot points | S3 | S2 | S1 | PP | R1 | R2 | R3 |
|---|---|---|---|---|---|---|---|
| Standard | 1,558.95 | 1,579.24 | 1,589.77 | 1,610.06 | 1,620.59 | 1,640.88 | 1,651.41 |
| Camarilla | 1,591.83 | 1,594.65 | 1,597.48 | 1,600.30 | 1,603.13 | 1,605.95 | 1,608.78 |
| Woodie | 1,554.07 | 1,576.80 | 1,584.89 | 1,607.62 | 1,615.71 | 1,638.44 | 1,646.53 |
| Fibonacci | 1,579.24 | 1,591.01 | 1,598.29 | 1,610.06 | 1,621.83 | 1,629.11 | 1,640.88 |
| Pivot points | S3 | S2 | S1 | PP | R1 | R2 | R3 |
|---|---|---|---|---|---|---|---|
| Standard | 1,486.92 | 1,530.27 | 1,565.28 | 1,608.63 | 1,643.64 | 1,686.99 | 1,722.00 |
| Camarilla | 1,578.75 | 1,585.93 | 1,593.12 | 1,600.30 | 1,607.48 | 1,614.67 | 1,621.85 |
| Woodie | 1,482.76 | 1,528.19 | 1,561.12 | 1,606.55 | 1,639.48 | 1,684.91 | 1,717.84 |
| Fibonacci | 1,530.27 | 1,560.20 | 1,578.69 | 1,608.63 | 1,638.56 | 1,657.05 | 1,686.99 |
Numerical data
The following are the details of the technical indicators and moving averages that were collected to generate this technical analysis:
| RSI (14): | 64.21 | |
| MACD (12,26,9): | 10.0400 | |
| Directional Movement: | 17.83 | |
| AROON (14): | 78.57 | |
| DEMA (21): | 1,641.16 | |
| Parabolic SAR (0,02-0,02-0,2): | 1,592.44 | |
| Elder Ray (13): | 41.23 | |
| Super Trend (3,10): | 1,614.64 | |
| Zig ZAG (10): | 1,675.13 | |
| VORTEX (21): | 1.0500 | |
| Stochastique (14,3,5): | 95.17 | |
| TEMA (21): | 1,643.55 | |
| Williams %R (14): | -3.06 | |
| Chande Momentum Oscillator (20): | 78.01 | |
| Repulse (5,40,3): | 2.3600 | |
| ROCnROLL: | 1 | |
| TRIX (15,9): | 0.0200 | |
| Courbe Coppock: | 3.11 |
| MA7: | 1,637.71 | |
| MA20: | 1,622.94 | |
| MA50: | 1,622.22 | |
| MA100: | 1,574.74 | |
| MAexp7: | 1,647.59 | |
| MAexp20: | 1,630.15 | |
| MAexp50: | 1,612.96 | |
| MAexp100: | 1,604.28 | |
| Price / MA7: | +2.45% | |
| Price / MA20: | +3.38% | |
| Price / MA50: | +3.43% | |
| Price / MA100: | +6.55% | |
| Price / MAexp7: | +1.84% | |
| Price / MAexp20: | +2.92% | |
| Price / MAexp50: | +4.02% | |
| Price / MAexp100: | +4.58% |
About author
Online


Add a comment
Comments
0 comments on the analysis ESTX SELECT DIV 30 EUR (PRICE) - Daily