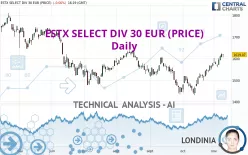
ESTX SELECT DIV 30 EUR (PRICE) - Daily - Technical analysis published on 11/09/2022 (GMT)
- 215
- 0
Click here for a new analysis!
- Timeframe : Daily
- - Analysis generated on
- Status : LEVEL MAINTAINED

Summary of the analysis

Additional analysis
Quotes
The ESTX SELECT DIV 30 EUR (PRICE) price is 1,619.07 EUR. On the day, this instrument lost -0.06% and was traded between 1,605.91 EUR and 1,621.71 EUR over the period. The price is currently at +0.82% from its lowest and -0.16% from its highest.The Central Gaps scanner detects a bearish opening marking the presence of sellers ahead of buyers at the opening but not sufficiently marked to allow the price to register a quotation gap.
Bearish opening
Type : Bearish
Timeframe : Openning
So that you have an overall view of the price change, here is a table showing the variations over several periods:
Near a new HIGH record (1 month)
Type : Bullish
Timeframe : Weekly
Technical
Technical analysis of this Daily chart of ESTX SELECT DIV 30 EUR (PRICE) indicates that the overall trend is strongly bullish. The signals given by the moving averages are 82.14% bullish. This strong bullish trend is confirmed by the strong signals currently being given by short-term moving averages. The Central Indicators market scanner currently does not detect any result that concerns moving averages.
In fact, according to the parameters integrated into the Central Analyzer system, 15 technical indicators out of 18 analysed are currently bullish. Caution: the Central Indicators scanner currently detects an excess:
RSI indicator is overbought : over 70
Type : Neutral
Timeframe : Daily
CCI indicator is overbought : over 100
Type : Neutral
Timeframe : Daily
CCI indicator: bearish divergence
Type : Bearish
Timeframe : Daily
RSI indicator: bearish divergence
Type : Bearish
Timeframe : Daily
Williams %R indicator is overbought : over -20
Type : Neutral
Timeframe : Daily
Pivot points : price is over resistance 1
Type : Neutral
Timeframe : Weekly
Price is back under the pivot point
Type : Bearish
Timeframe : Daily
No signals are given by Central Patterns, a market scanner specialised in chart patterns, resistances and supports.
The presence of a bearish pattern in Japanese candlesticks detected by Central Candlesticks that could cause a correction in the very short term was also detected:
Bearish harami
Type : Bearish
Timeframe : Daily
| S3 | S2 | S1 | Price | R1 | R2 | R3 | |
|---|---|---|---|---|---|---|---|
| ProTrendLines | 1,476.88 | 1,520.34 | 1,597.26 | 1,619.07 | 1,739.87 | 1,798.17 | 1,854.52 |
| Change (%) | -8.78% | -6.10% | -1.35% | - | +7.46% | +11.06% | +14.54% |
| Change | -142.19 | -98.73 | -21.81 | - | +120.80 | +179.10 | +235.45 |
| Level | Major | Major | Major | - | Intermediate | Intermediate | Major |
Attention could also be paid to pivot points to set price objectives:
| Pivot points | S3 | S2 | S1 | PP | R1 | R2 | R3 |
|---|---|---|---|---|---|---|---|
| Standard | 1,590.37 | 1,597.92 | 1,608.95 | 1,616.50 | 1,627.53 | 1,635.08 | 1,646.11 |
| Camarilla | 1,614.88 | 1,616.58 | 1,618.29 | 1,619.99 | 1,621.69 | 1,623.40 | 1,625.10 |
| Woodie | 1,592.12 | 1,598.79 | 1,610.70 | 1,617.37 | 1,629.28 | 1,635.95 | 1,647.86 |
| Fibonacci | 1,597.92 | 1,605.01 | 1,609.40 | 1,616.50 | 1,623.59 | 1,627.98 | 1,635.08 |
| Pivot points | S3 | S2 | S1 | PP | R1 | R2 | R3 |
|---|---|---|---|---|---|---|---|
| Standard | 1,524.90 | 1,541.95 | 1,568.33 | 1,585.38 | 1,611.76 | 1,628.81 | 1,655.19 |
| Camarilla | 1,582.76 | 1,586.74 | 1,590.72 | 1,594.70 | 1,598.68 | 1,602.66 | 1,606.64 |
| Woodie | 1,529.56 | 1,544.28 | 1,572.99 | 1,587.71 | 1,616.42 | 1,631.14 | 1,659.85 |
| Fibonacci | 1,541.95 | 1,558.54 | 1,568.79 | 1,585.38 | 1,601.97 | 1,612.22 | 1,628.81 |
| Pivot points | S3 | S2 | S1 | PP | R1 | R2 | R3 |
|---|---|---|---|---|---|---|---|
| Standard | 1,328.88 | 1,379.76 | 1,478.62 | 1,529.50 | 1,628.36 | 1,679.24 | 1,778.10 |
| Camarilla | 1,536.31 | 1,550.04 | 1,563.76 | 1,577.49 | 1,591.22 | 1,604.94 | 1,618.67 |
| Woodie | 1,352.88 | 1,391.76 | 1,502.62 | 1,541.50 | 1,652.36 | 1,691.24 | 1,802.10 |
| Fibonacci | 1,379.76 | 1,436.96 | 1,472.30 | 1,529.50 | 1,586.70 | 1,622.04 | 1,679.24 |
Numerical data
The following are the details of the technical indicators and moving averages that were collected to generate this technical analysis:
| RSI (14): | 70.36 | |
| MACD (12,26,9): | 26.0900 | |
| Directional Movement: | 22.75 | |
| AROON (14): | 85.72 | |
| DEMA (21): | 1,593.13 | |
| Parabolic SAR (0,02-0,02-0,2): | 1,568.88 | |
| Elder Ray (13): | 34.68 | |
| Super Trend (3,10): | 1,547.58 | |
| Zig ZAG (10): | 1,616.91 | |
| VORTEX (21): | 1.2700 | |
| Stochastique (14,3,5): | 95.52 | |
| TEMA (21): | 1,617.97 | |
| Williams %R (14): | -5.78 | |
| Chande Momentum Oscillator (20): | 75.23 | |
| Repulse (5,40,3): | 1.8200 | |
| ROCnROLL: | 1 | |
| TRIX (15,9): | 0.1700 | |
| Courbe Coppock: | 11.55 |
| MA7: | 1,595.60 | |
| MA20: | 1,552.30 | |
| MA50: | 1,531.93 | |
| MA100: | 1,547.11 | |
| MAexp7: | 1,598.10 | |
| MAexp20: | 1,563.73 | |
| MAexp50: | 1,547.86 | |
| MAexp100: | 1,572.26 | |
| Price / MA7: | +1.47% | |
| Price / MA20: | +4.30% | |
| Price / MA50: | +5.69% | |
| Price / MA100: | +4.65% | |
| Price / MAexp7: | +1.31% | |
| Price / MAexp20: | +3.54% | |
| Price / MAexp50: | +4.60% | |
| Price / MAexp100: | +2.98% |
About author
Online


Add a comment
Comments
0 comments on the analysis ESTX SELECT DIV 30 EUR (PRICE) - Daily