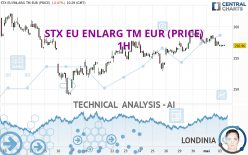
STX EU ENLARG TM EUR (PRICE) - 1H - Technical analysis published on 05/03/2024 (GMT)
- 83
- 0
Click here for a new analysis!
- Timeframe : 1H
- - Analysis generated on
- Status : TARGET REACHED

Summary of the analysis

Additional analysis
Quotes
The STX EU ENLARG TM EUR (PRICE) price is 257.02 EUR. The price is lower by -0.05% since the last closing and was traded between 256.73 EUR and 257.14 EUR over the period. The price is currently at +0.11% from its lowest and -0.05% from its highest.The Central Gaps scanner detects a bearish opening marking the presence of sellers ahead of buyers at the opening but not sufficiently marked to allow the price to register a quotation gap.
Bearish opening
Type : Bearish
Timeframe : Openning
A study of price movements over other periods shows the following variations:
Near a new HIGH record (5 years)
Type : Bullish
Timeframe : Weekly
Near a new HIGH record (1 year)
Type : Bullish
Timeframe : Weekly
Near a new HIGH record (1st january)
Type : Bullish
Timeframe : Weekly
Near a new LOW record (1 month)
Type : Bearish
Timeframe : Weekly
Technical
Technical analysis of STX EU ENLARG TM EUR (PRICE) in 1H shows an overall bullish trend. 67.86% of the signals given by moving averages are bullish. Caution: the neutral signals currently given by short-term moving averages show us that the global trend is losing momentum. The Central Indicators scanner detects a bullish signal on moving averages that could impact this trend:
Bullish price crossover with adaptative moving average 100
Type : Bullish
Timeframe : 1 hour
The technical indicators are generally neutral. They do not provide relevant information on the direction of future price movements.
Caution: the Central Indicators scanner currently detects an excess:
CCI indicator is oversold : under -100
Type : Neutral
Timeframe : 1 hour
Williams %R indicator is oversold : under -80
Type : Neutral
Timeframe : 1 hour
MACD indicator is back under 0
Type : Bearish
Timeframe : 1 hour
Central Patterns, the scanner specializing in chart patterns, did not identify any signals.
Central Candlesticks, the scanner specialised in Japanese candlesticks, detects these bearish signals that could support the hypothesis of a small drop in the very short term:
Bearish harami
Type : Bearish
Timeframe : 1 hour
Bearish harami cross
Type : Bearish
Timeframe : 1 hour
| S3 | S2 | S1 | Price | R1 | R2 | R3 | |
|---|---|---|---|---|---|---|---|
| ProTrendLines | 249.00 | 253.72 | 256.31 | 257.02 | 257.74 | 259.59 | 260.77 |
| Change (%) | -3.12% | -1.28% | -0.28% | - | +0.28% | +1.00% | +1.46% |
| Change | -8.02 | -3.30 | -0.71 | - | +0.72 | +2.57 | +3.75 |
| Level | Minor | Major | Minor | - | Major | Intermediate | Major |
Attention could also be paid to pivot points to set price objectives:
| Pivot points | S3 | S2 | S1 | PP | R1 | R2 | R3 |
|---|---|---|---|---|---|---|---|
| Standard | 254.72 | 255.82 | 256.48 | 257.58 | 258.24 | 259.34 | 260.00 |
| Camarilla | 256.67 | 256.83 | 256.99 | 257.15 | 257.31 | 257.47 | 257.63 |
| Woodie | 254.51 | 255.71 | 256.27 | 257.47 | 258.03 | 259.23 | 259.79 |
| Fibonacci | 255.82 | 256.49 | 256.90 | 257.58 | 258.25 | 258.66 | 259.34 |
| Pivot points | S3 | S2 | S1 | PP | R1 | R2 | R3 |
|---|---|---|---|---|---|---|---|
| Standard | 248.69 | 250.78 | 253.57 | 255.66 | 258.45 | 260.54 | 263.33 |
| Camarilla | 255.01 | 255.46 | 255.90 | 256.35 | 256.80 | 257.25 | 257.69 |
| Woodie | 249.03 | 250.96 | 253.91 | 255.84 | 258.79 | 260.72 | 263.67 |
| Fibonacci | 250.78 | 252.65 | 253.80 | 255.66 | 257.53 | 258.68 | 260.54 |
| Pivot points | S3 | S2 | S1 | PP | R1 | R2 | R3 |
|---|---|---|---|---|---|---|---|
| Standard | 236.49 | 242.74 | 250.04 | 256.29 | 263.59 | 269.84 | 277.14 |
| Camarilla | 253.60 | 254.85 | 256.09 | 257.33 | 258.57 | 259.81 | 261.06 |
| Woodie | 237.01 | 243.00 | 250.56 | 256.55 | 264.11 | 270.10 | 277.66 |
| Fibonacci | 242.74 | 247.92 | 251.12 | 256.29 | 261.47 | 264.67 | 269.84 |
Numerical data
The following is the status of technical indicators and moving averages registered at the time this technical analysis was created:
| RSI (14): | 45.99 | |
| MACD (12,26,9): | 0.0000 | |
| Directional Movement: | -6.95 | |
| AROON (14): | -42.86 | |
| DEMA (21): | 257.61 | |
| Parabolic SAR (0,02-0,02-0,2): | 258.01 | |
| Elder Ray (13): | -0.46 | |
| Super Trend (3,10): | 256.75 | |
| Zig ZAG (10): | 256.98 | |
| VORTEX (21): | 0.8400 | |
| Stochastique (14,3,5): | 12.43 | |
| TEMA (21): | 257.23 | |
| Williams %R (14): | -85.57 | |
| Chande Momentum Oscillator (20): | -0.28 | |
| Repulse (5,40,3): | -0.0100 | |
| ROCnROLL: | -1 | |
| TRIX (15,9): | 0.0100 | |
| Courbe Coppock: | 0.69 |
| MA7: | 256.60 | |
| MA20: | 256.50 | |
| MA50: | 253.10 | |
| MA100: | 246.00 | |
| MAexp7: | 257.20 | |
| MAexp20: | 257.48 | |
| MAexp50: | 257.02 | |
| MAexp100: | 256.44 | |
| Price / MA7: | +0.16% | |
| Price / MA20: | +0.20% | |
| Price / MA50: | +1.55% | |
| Price / MA100: | +4.48% | |
| Price / MAexp7: | -0.07% | |
| Price / MAexp20: | -0.18% | |
| Price / MAexp50: | -0% | |
| Price / MAexp100: | +0.23% |
About author
Online


Add a comment
Comments
0 comments on the analysis STX EU ENLARG TM EUR (PRICE) - 1H