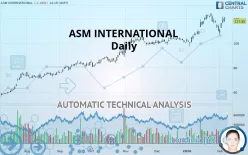
ASM INTERNATIONAL - Daily - Technical analysis published on 02/06/2020 (GMT)
- 360
- 0
- Who voted?
Click here for a new analysis!
- Timeframe : Daily
- - Analysis generated on
- Status : TARGET REACHED

Summary of the analysis

Additional analysis
Quotes
ASM INTERNATIONAL rating 117.95 EUR. The price has increased by -1.26% since the last closing and was traded between 117.00 EUR and 121.15 EUR over the period. The price is currently at +0.81% from its lowest and -2.64% from its highest.A study of price movements over other periods shows the following variations:
Near a new HIGH record (5 years)
Type : Bullish
Timeframe : Weekly
Near a new HIGH record (1st january)
Type : Bullish
Timeframe : Weekly
Near a new HIGH record (1 month)
Type : Bullish
Timeframe : Weekly
Technical
A technical analysis in Daily of this ASM INTERNATIONAL chart shows a strongly bullish trend. 92.86% of the signals given by moving averages are bullish. The overall trend is supported by the strong bullish signals from short-term moving averages. There is no crossing of moving average by the price or crossing of moving averages between themselves.
In fact, only 8 technical indicators out of 18 studied are currently bullish. But beware of excesses. The Central Indicators scanner currently detects this:
Williams %R indicator is overbought : over -20
Type : Neutral
Timeframe : Daily
Parabolic SAR indicator bullish reversal
Type : Bullish
Timeframe : Daily
Price is back over the pivot point
Type : Bullish
Timeframe : Daily
Price is back under the pivot point
Type : Bearish
Timeframe : Weekly
An analysis of the price chart with the Central Patterns scanner (detector of chart patterns and resistances and supports) shows several results that can have an impact on the price change:
Near horizontal support
Type : Bullish
Timeframe : Daily
Support of channel is broken
Type : Bearish
Timeframe : Daily
The presence of a bullish Japanese candlestick pattern detected by Central Candlesticks that could cause a very short term rebound was also detected:
Upside gap
Type : Bullish
Timeframe : Daily
| S3 | S2 | S1 | Price | R1 | |
|---|---|---|---|---|---|
| ProTrendLines | 62.55 | 84.71 | 104.40 | 117.95 | 123.95 |
| Change (%) | -46.97% | -28.18% | -11.49% | - | +5.09% |
| Change | -55.40 | -33.24 | -13.55 | - | +6.00 |
| Level | Major | Minor | Major | - | Major |
Attention could also be paid to pivot points to set price objectives:
| Pivot points | S3 | S2 | S1 | PP | R1 | R2 | R3 |
|---|---|---|---|---|---|---|---|
| Standard | 111.32 | 113.88 | 116.67 | 119.23 | 122.02 | 124.58 | 127.37 |
| Camarilla | 117.98 | 118.47 | 118.96 | 119.45 | 119.94 | 120.43 | 120.92 |
| Woodie | 111.43 | 113.94 | 116.78 | 119.29 | 122.13 | 124.64 | 127.48 |
| Fibonacci | 113.88 | 115.93 | 117.19 | 119.23 | 121.28 | 122.54 | 124.58 |
| Pivot points | S3 | S2 | S1 | PP | R1 | R2 | R3 |
|---|---|---|---|---|---|---|---|
| Standard | 92.90 | 101.25 | 105.65 | 114.00 | 118.40 | 126.75 | 131.15 |
| Camarilla | 106.54 | 107.71 | 108.88 | 110.05 | 111.22 | 112.39 | 113.56 |
| Woodie | 90.93 | 100.26 | 103.68 | 113.01 | 116.43 | 125.76 | 129.18 |
| Fibonacci | 101.25 | 106.12 | 109.13 | 114.00 | 118.87 | 121.88 | 126.75 |
| Pivot points | S3 | S2 | S1 | PP | R1 | R2 | R3 |
|---|---|---|---|---|---|---|---|
| Standard | 69.47 | 83.36 | 96.71 | 110.60 | 123.95 | 137.84 | 151.19 |
| Camarilla | 102.56 | 105.06 | 107.55 | 110.05 | 112.55 | 115.04 | 117.54 |
| Woodie | 69.19 | 83.23 | 96.43 | 110.47 | 123.67 | 137.71 | 150.91 |
| Fibonacci | 83.36 | 93.77 | 100.20 | 110.60 | 121.01 | 127.44 | 137.84 |
Numerical data
The following is the status of the technical indicators and moving averages at the time of publication of this technical analysis:
| RSI (14): | 58.03 | |
| MACD (12,26,9): | 2.5900 | |
| Directional Movement: | 14.43 | |
| AROON (14): | -42.86 | |
| DEMA (21): | 118.57 | |
| Parabolic SAR (0,02-0,02-0,2): | 107.83 | |
| Elder Ray (13): | 3.10 | |
| Super Trend (3,10): | 121.00 | |
| Zig ZAG (10): | 118.10 | |
| VORTEX (21): | 1.0400 | |
| Stochastique (14,3,5): | 60.77 | |
| TEMA (21): | 118.10 | |
| Williams %R (14): | -38.64 | |
| Chande Momentum Oscillator (20): | -5.00 | |
| Repulse (5,40,3): | -0.0700 | |
| ROCnROLL: | 1 | |
| TRIX (15,9): | 0.4500 | |
| Courbe Coppock: | 2.45 |
| MA7: | 115.04 | |
| MA20: | 116.28 | |
| MA50: | 107.80 | |
| MA100: | 99.11 | |
| MAexp7: | 116.44 | |
| MAexp20: | 114.74 | |
| MAexp50: | 108.74 | |
| MAexp100: | 99.70 | |
| Price / MA7: | +2.53% | |
| Price / MA20: | +1.44% | |
| Price / MA50: | +9.42% | |
| Price / MA100: | +19.01% | |
| Price / MAexp7: | +1.30% | |
| Price / MAexp20: | +2.80% | |
| Price / MAexp50: | +8.47% | |
| Price / MAexp100: | +18.30% |
News
The last news published on ASM INTERNATIONAL at the time of the generation of this analysis was as follows:
- ASMI Share Buyback Update January 27 - 31, 2020
- Researchers Present Positive Interim Data on Appili Therapeutics’ ATI-1701 Biodefense Program at 2020 ASM Biothreats
- ASMI Share Buyback Update January 20 - 24, 2020
- ContraFect to Present at 2020 ASM Biothreats
- ASMI Share Buyback Update January 13 - 17, 2020
About author

Online


Add a comment
Comments
0 comments on the analysis ASM INTERNATIONAL - Daily