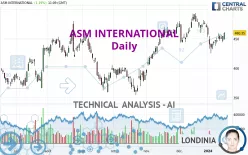
ASM INTERNATIONAL - Daily - Technical analysis published on 01/17/2024 (GMT)
- 178
- 0
Click here for a new analysis!
- Timeframe : Daily
- - Analysis generated on
- Status : TARGET REACHED

Summary of the analysis

Additional analysis
Quotes
The ASM INTERNATIONAL rating is 460.35 EUR. The price registered an increase of +1.19% on the session with the lowest point at 449.25 EUR and the highest point at 461.00 EUR. The deviation from the price is +2.47% for the low point and -0.14% for the high point.Here is a more detailed summary of the historical variations registered by ASM INTERNATIONAL:
New HIGH record (1st january)
Type : Bullish
Timeframe : Weekly
Near a new HIGH record (1st january)
Type : Bullish
Timeframe : Weekly
Technical
Technical analysis of this Daily chart of ASM INTERNATIONAL indicates that the overall trend is strongly bullish. The signals given by moving averages are 89.29% bullish. This strongly bullish trend seems to be running out of steam given the signals being given by short-term moving averages. An assessment of moving averages reveals several bullish signals that could impact this trend:
Bullish trend reversal : adaptative moving average 20
Type : Bullish
Timeframe : Daily
Bullish price crossover with Moving Average 20
Type : Bullish
Timeframe : Daily
Bullish price crossover with Moving Average 50
Type : Bullish
Timeframe : Daily
On the 18 technical indicators analysed, 9 are bullish, 5 are neutral and 4 are bearish. Central Indicators, the scanner specialised in technical indicators, has identified these signals:
Pivot points : price is over resistance 1
Type : Neutral
Timeframe : Daily
RSI indicator is back over 50
Type : Bullish
Timeframe : Daily
Central Patterns, the scanner specializing in chart patterns, did not identify any signals.
The Central Candlesticks scanner, specialised in Japanese candlesticks, did not identify any signals.
| S3 | S2 | S1 | Price | R1 | R2 | |
|---|---|---|---|---|---|---|
| ProTrendLines | 399.86 | 427.77 | 457.20 | 460.35 | 476.23 | 491.60 |
| Change (%) | -13.14% | -7.08% | -0.68% | - | +3.45% | +6.79% |
| Change | -60.49 | -32.58 | -3.15 | - | +15.88 | +31.25 |
| Level | Minor | Major | Major | - | Intermediate | Major |
To determine price objectives, it is also possible to use the pivot points. Here is the price position in relation to pivot points:
| Pivot points | S3 | S2 | S1 | PP | R1 | R2 | R3 |
|---|---|---|---|---|---|---|---|
| Standard | 437.62 | 441.08 | 448.02 | 451.48 | 458.42 | 461.88 | 468.82 |
| Camarilla | 452.09 | 453.04 | 454.00 | 454.95 | 455.90 | 456.86 | 457.81 |
| Woodie | 439.35 | 441.95 | 449.75 | 452.35 | 460.15 | 462.75 | 470.55 |
| Fibonacci | 441.08 | 445.06 | 447.51 | 451.48 | 455.46 | 457.91 | 461.88 |
| Pivot points | S3 | S2 | S1 | PP | R1 | R2 | R3 |
|---|---|---|---|---|---|---|---|
| Standard | 418.30 | 428.10 | 439.20 | 449.00 | 460.10 | 469.90 | 481.00 |
| Camarilla | 444.55 | 446.47 | 448.38 | 450.30 | 452.22 | 454.13 | 456.05 |
| Woodie | 418.95 | 428.43 | 439.85 | 449.33 | 460.75 | 470.23 | 481.65 |
| Fibonacci | 428.10 | 436.08 | 441.02 | 449.00 | 456.98 | 461.92 | 469.90 |
| Pivot points | S3 | S2 | S1 | PP | R1 | R2 | R3 |
|---|---|---|---|---|---|---|---|
| Standard | 393.73 | 418.52 | 444.23 | 469.02 | 494.73 | 519.52 | 545.23 |
| Camarilla | 456.06 | 460.69 | 465.32 | 469.95 | 474.58 | 479.21 | 483.84 |
| Woodie | 394.20 | 418.75 | 444.70 | 469.25 | 495.20 | 519.75 | 545.70 |
| Fibonacci | 418.52 | 437.81 | 449.73 | 469.02 | 488.31 | 500.23 | 519.52 |
Numerical data
The following is the status of the technical indicators and moving averages at the time of publication of this technical analysis:
| RSI (14): | 53.84 | |
| MACD (12,26,9): | -1.7500 | |
| Directional Movement: | -5.19 | |
| AROON (14): | -35.71 | |
| DEMA (21): | 454.11 | |
| Parabolic SAR (0,02-0,02-0,2): | 462.77 | |
| Elder Ray (13): | 1.20 | |
| Super Trend (3,10): | 472.55 | |
| Zig ZAG (10): | 459.65 | |
| VORTEX (21): | 0.8100 | |
| Stochastique (14,3,5): | 52.61 | |
| TEMA (21): | 447.63 | |
| Williams %R (14): | -37.79 | |
| Chande Momentum Oscillator (20): | -9.80 | |
| Repulse (5,40,3): | 3.8200 | |
| ROCnROLL: | 1 | |
| TRIX (15,9): | -0.0500 | |
| Courbe Coppock: | 9.66 |
| MA7: | 451.16 | |
| MA20: | 459.03 | |
| MA50: | 457.14 | |
| MA100: | 428.69 | |
| MAexp7: | 453.26 | |
| MAexp20: | 455.32 | |
| MAexp50: | 449.52 | |
| MAexp100: | 434.21 | |
| Price / MA7: | +2.04% | |
| Price / MA20: | +0.29% | |
| Price / MA50: | +0.70% | |
| Price / MA100: | +7.39% | |
| Price / MAexp7: | +1.56% | |
| Price / MAexp20: | +1.10% | |
| Price / MAexp50: | +2.41% | |
| Price / MAexp100: | +6.02% |
News
Don't forget to follow the news on ASM INTERNATIONAL. At the time of publication of this analysis, the latest news was as follows:
- ASM nominates Tania Micki to Supervisory Board
- ASM International N.V. reports third quarter 2023
- ASM hosts Investor Day, increases 2025 revenue targets and provides guidance for 2027
- ASM announces completion of share buyback program
- ASM share buyback update September 11 – 15, 2023
About author
Online


Add a comment
Comments
0 comments on the analysis ASM INTERNATIONAL - Daily