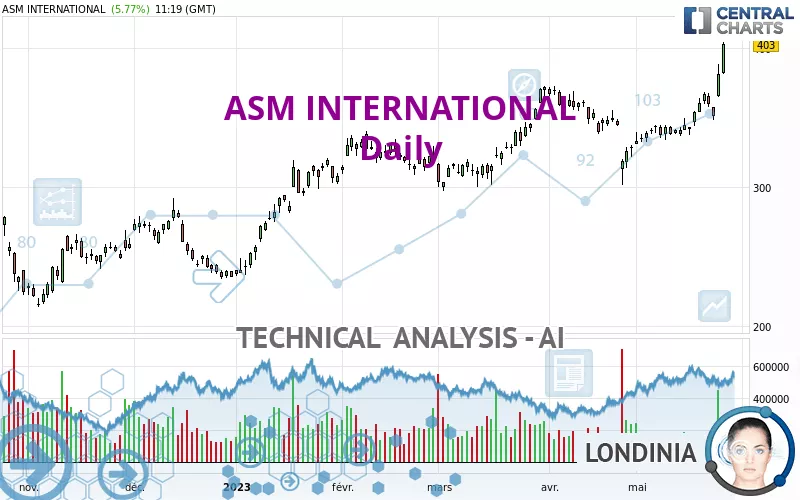
ASM INTERNATIONAL - Daily - Technical analysis published on 05/26/2023 (GMT)
- 223
- 0
Click here for a new analysis!
- Timeframe : Daily
- - Analysis generated on
- Status : LEVEL MAINTAINED
Summary of the analysis

Additional analysis
Quotes
The ASM INTERNATIONAL rating is 403.00 EUR. The price registered an increase of +5.77% on the session with the lowest point at 381.00 EUR and the highest point at 404.15 EUR. The deviation from the price is +5.77% for the low point and -0.28% for the high point.A study of price movements over other periods shows the following variations:
New HIGH record (1 year)
Type : Bullish
Timeframe : Weekly
New HIGH record (1st january)
Type : Bullish
Timeframe : Weekly
New HIGH record (1 month)
Type : Bullish
Timeframe : Weekly
Technical
Technical analysis of ASM INTERNATIONAL in Daily shows a strongly overall bullish trend. 92.86% of the signals given by moving averages are bullish. The overall trend is supported by the strong bullish signals from short-term moving averages. The Central Indicators market scanner currently does not detect any result that concerns moving averages.
The probability of a further increase is high given the direction of the technical indicators.
Caution: the Central Indicators scanner currently detects an excess:
RSI indicator is overbought : over 70
Type : Neutral
Timeframe : Daily
CCI indicator is overbought : over 100
Type : Neutral
Timeframe : Daily
Williams %R indicator is overbought : over -20
Type : Neutral
Timeframe : Daily
Pivot points : price is over resistance 2
Type : Neutral
Timeframe : Daily
Pivot points : price is over resistance 3
Type : Neutral
Timeframe : Weekly
Central Patterns, the market scanner focusing on chart patterns, resistances and supports found these results:
Near horizontal resistance
Type : Bearish
Timeframe : Daily
Resistance of channel is broken
Type : Bullish
Timeframe : Daily
The Central Candlesticks scanner, specialised in Japanese candlesticks, did not identify any signals.
| S3 | S2 | S1 | Price | R1 | |
|---|---|---|---|---|---|
| ProTrendLines | 276.13 | 313.16 | 369.17 | 403.00 | 427.77 |
| Change (%) | -31.48% | -22.29% | -8.39% | - | +6.15% |
| Change | -126.87 | -89.84 | -33.83 | - | +24.77 |
| Level | Minor | Major | Major | - | Major |
Pivot points can also be used to set your price objectives. Here is the price situation in relation to pivot points:
| Pivot points | S3 | S2 | S1 | PP | R1 | R2 | R3 |
|---|---|---|---|---|---|---|---|
| Standard | 343.73 | 354.07 | 367.53 | 377.87 | 391.33 | 401.67 | 415.13 |
| Camarilla | 374.46 | 376.64 | 378.82 | 381.00 | 383.18 | 385.36 | 387.55 |
| Woodie | 345.30 | 354.85 | 369.10 | 378.65 | 392.90 | 402.45 | 416.70 |
| Fibonacci | 354.07 | 363.16 | 368.78 | 377.87 | 386.96 | 392.58 | 401.67 |
| Pivot points | S3 | S2 | S1 | PP | R1 | R2 | R3 |
|---|---|---|---|---|---|---|---|
| Standard | 311.35 | 322.68 | 341.49 | 352.82 | 371.63 | 382.96 | 401.77 |
| Camarilla | 352.01 | 354.77 | 357.54 | 360.30 | 363.06 | 365.83 | 368.59 |
| Woodie | 315.09 | 324.55 | 345.23 | 354.69 | 375.37 | 384.83 | 405.51 |
| Fibonacci | 322.68 | 334.19 | 341.31 | 352.82 | 364.33 | 371.45 | 382.96 |
| Pivot points | S3 | S2 | S1 | PP | R1 | R2 | R3 |
|---|---|---|---|---|---|---|---|
| Standard | 223.25 | 261.30 | 293.49 | 331.54 | 363.73 | 401.78 | 433.97 |
| Camarilla | 306.35 | 312.79 | 319.23 | 325.67 | 332.11 | 338.55 | 344.99 |
| Woodie | 220.31 | 259.84 | 290.55 | 330.08 | 360.79 | 400.32 | 431.03 |
| Fibonacci | 261.30 | 288.14 | 304.71 | 331.54 | 358.38 | 374.95 | 401.78 |
Numerical data
The following are the details of the technical indicators and moving averages that were collected to generate this technical analysis:
| RSI (14): | 72.97 | |
| MACD (12,26,9): | 10.2800 | |
| Directional Movement: | 28.62 | |
| AROON (14): | 85.71 | |
| DEMA (21): | 365.65 | |
| Parabolic SAR (0,02-0,02-0,2): | 348.35 | |
| Elder Ray (13): | 32.04 | |
| Super Trend (3,10): | 352.35 | |
| Zig ZAG (10): | 402.90 | |
| VORTEX (21): | 1.2600 | |
| Stochastique (14,3,5): | 79.46 | |
| TEMA (21): | 372.91 | |
| Williams %R (14): | -1.51 | |
| Chande Momentum Oscillator (20): | 62.49 | |
| Repulse (5,40,3): | 9.2100 | |
| ROCnROLL: | 1 | |
| TRIX (15,9): | 0.1700 | |
| Courbe Coppock: | 19.65 |
| MA7: | 367.85 | |
| MA20: | 347.46 | |
| MA50: | 344.53 | |
| MA100: | 325.16 | |
| MAexp7: | 370.80 | |
| MAexp20: | 354.66 | |
| MAexp50: | 342.25 | |
| MAexp100: | 325.13 | |
| Price / MA7: | +9.56% | |
| Price / MA20: | +15.98% | |
| Price / MA50: | +16.97% | |
| Price / MA100: | +23.94% | |
| Price / MAexp7: | +8.68% | |
| Price / MAexp20: | +13.63% | |
| Price / MAexp50: | +17.75% | |
| Price / MAexp100: | +23.95% |
News
Don't forget to follow the news on ASM INTERNATIONAL. At the time of publication of this analysis, the latest news was as follows:
- ASM share buyback update May 15 – 18, 2023
- ASM share buyback update May 8 – 12, 2023
- ASM share buyback update May 2 – 5, 2023
- ASM share buyback update April 27 – 28, 2023
- ASM International N.V. reports first quarter 2023
About author
Online


Add a comment
Comments
0 comments on the analysis ASM INTERNATIONAL - Daily