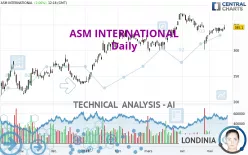
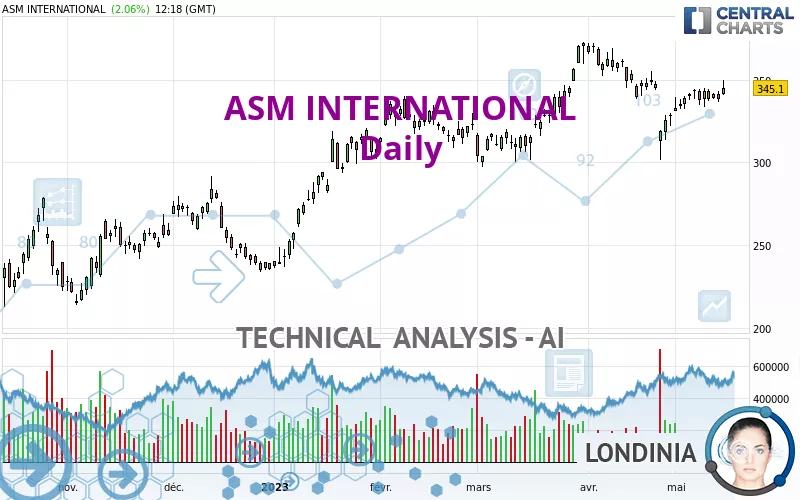
ASM INTERNATIONAL - Daily - Technical analysis published on 05/16/2023 (GMT)
- 157
- 0
Click here for a new analysis!
- Timeframe : Daily
- - Analysis generated on
- Status : TARGET REACHED
Summary of the analysis

Additional analysis
Quotes
The ASM INTERNATIONAL rating is 345.10 EUR. On the day, this instrument gained +2.06% and was traded between 340.70 EUR and 349.60 EUR over the period. The price is currently at +1.29% from its lowest and -1.29% from its highest.The Central Gaps scanner detects a bullish opening marking the presence of buyers ahead of sellers at the opening but not sufficiently marked to allow the price to register a quotation gap.
Bullish opening
Type : Bullish
Timeframe : Openning
A study of price movements over other periods shows the following variations:
Near a new HIGH record (1 month)
Type : Bullish
Timeframe : Weekly
Technical
Technical analysis of this Daily chart of ASM INTERNATIONAL indicates that the overall trend is strongly bullish. 89.29% of the signals given by moving averages are bullish. The slightly bullish signals given by the short-term moving averages indicate this trend is showing signs of running out of steam. The Central Indicators scanner detects a bullish signal on moving averages that could impact this trend:
Bullish price crossover with Moving Average 20
Type : Bullish
Timeframe : Daily
In fact, 12 technical indicators on 18 studied are currently positioned bullish. Caution: the Central Indicators scanner currently detects an excess:
MACD indicator: bullish divergence
Type : Bullish
Timeframe : Daily
Williams %R indicator is overbought : over -20
Type : Neutral
Timeframe : Daily
Pivot points : price is over resistance 1
Type : Neutral
Timeframe : Daily
RSI indicator is back over 50
Type : Bullish
Timeframe : Daily
MACD crosses UP its Moving Average
Type : Bullish
Timeframe : Daily
Aroon indicator bullish trend
Type : Bullish
Timeframe : Daily
Ichimoku : price is over the cloud
Type : Bullish
Timeframe : Daily
Central Patterns, the market scanner focusing on chart patterns, resistances and supports found these results:
Near resistance of channel
Type : Bearish
Timeframe : Daily
Horizontal resistance is broken
Type : Bullish
Timeframe : Daily
Resistance of triangle is broken
Type : Bullish
Timeframe : Daily
The Central Candlesticks scanner which studies Japanese candlesticks did not detect anything.
| S3 | S2 | S1 | Price | R1 | R2 | R3 | |
|---|---|---|---|---|---|---|---|
| ProTrendLines | 278.15 | 315.45 | 343.45 | 345.10 | 355.95 | 371.87 | 430.90 |
| Change (%) | -19.40% | -8.59% | -0.48% | - | +3.14% | +7.76% | +24.86% |
| Change | -66.95 | -29.65 | -1.65 | - | +10.85 | +26.77 | +85.80 |
| Level | Minor | Major | Intermediate | - | Intermediate | Intermediate | Major |
To determine price objectives, it is also possible to use the pivot points. Here is the price position in relation to pivot points:
| Pivot points | S3 | S2 | S1 | PP | R1 | R2 | R3 |
|---|---|---|---|---|---|---|---|
| Standard | 328.92 | 332.68 | 335.42 | 339.18 | 341.92 | 345.68 | 348.42 |
| Camarilla | 336.36 | 336.96 | 337.55 | 338.15 | 338.75 | 339.34 | 339.94 |
| Woodie | 328.40 | 332.43 | 334.90 | 338.93 | 341.40 | 345.43 | 347.90 |
| Fibonacci | 332.68 | 335.17 | 336.70 | 339.18 | 341.67 | 343.20 | 345.68 |
| Pivot points | S3 | S2 | S1 | PP | R1 | R2 | R3 |
|---|---|---|---|---|---|---|---|
| Standard | 323.78 | 328.67 | 334.83 | 339.72 | 345.88 | 350.77 | 356.93 |
| Camarilla | 337.96 | 338.97 | 339.99 | 341.00 | 342.01 | 343.03 | 344.04 |
| Woodie | 324.43 | 328.99 | 335.48 | 340.04 | 346.53 | 351.09 | 357.58 |
| Fibonacci | 328.67 | 332.89 | 335.50 | 339.72 | 343.94 | 346.55 | 350.77 |
| Pivot points | S3 | S2 | S1 | PP | R1 | R2 | R3 |
|---|---|---|---|---|---|---|---|
| Standard | 224.88 | 263.22 | 295.63 | 333.97 | 366.38 | 404.72 | 437.13 |
| Camarilla | 308.59 | 315.08 | 321.57 | 328.05 | 334.54 | 341.02 | 347.51 |
| Woodie | 221.93 | 261.74 | 292.68 | 332.49 | 363.43 | 403.24 | 434.18 |
| Fibonacci | 263.22 | 290.24 | 306.94 | 333.97 | 360.99 | 377.69 | 404.72 |
Numerical data
The following are the details of the technical indicators and moving averages that were collected to generate this technical analysis:
| RSI (14): | 53.12 | |
| MACD (12,26,9): | -0.3100 | |
| Directional Movement: | -1.66 | |
| AROON (14): | 92.86 | |
| DEMA (21): | 340.59 | |
| Parabolic SAR (0,02-0,02-0,2): | 317.29 | |
| Elder Ray (13): | 4.78 | |
| Super Trend (3,10): | 349.74 | |
| Zig ZAG (10): | 345.05 | |
| VORTEX (21): | 0.9600 | |
| Stochastique (14,3,5): | 80.40 | |
| TEMA (21): | 337.61 | |
| Williams %R (14): | -9.37 | |
| Chande Momentum Oscillator (20): | 19.30 | |
| Repulse (5,40,3): | 0.2200 | |
| ROCnROLL: | 1 | |
| TRIX (15,9): | -0.0400 | |
| Courbe Coppock: | 0.54 |
| MA7: | 340.85 | |
| MA20: | 339.38 | |
| MA50: | 338.49 | |
| MA100: | 317.27 | |
| MAexp7: | 340.67 | |
| MAexp20: | 340.76 | |
| MAexp50: | 335.75 | |
| MAexp100: | 320.46 | |
| Price / MA7: | +1.25% | |
| Price / MA20: | +1.69% | |
| Price / MA50: | +1.95% | |
| Price / MA100: | +8.77% | |
| Price / MAexp7: | +1.30% | |
| Price / MAexp20: | +1.27% | |
| Price / MAexp50: | +2.78% | |
| Price / MAexp100: | +7.69% |
News
The latest news and videos published on ASM INTERNATIONAL at the time of the analysis were as follows:
- ASM share buyback update May 8 – 12, 2023
- ASM share buyback update May 2 – 5, 2023
- ASM share buyback update April 27 – 28, 2023
- ASM International N.V. reports first quarter 2023
- ASM INTERNATIONAL N.V. PUBLISHES ANNUAL REPORT 2022
About author
Online


Add a comment
Comments
0 comments on the analysis ASM INTERNATIONAL - Daily