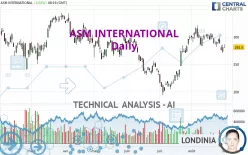
ASM INTERNATIONAL - Daily - Technical analysis published on 08/31/2022 (GMT)
- 173
- 0
- Who voted?
- Timeframe : Daily
- - Analysis generated on
- Status : NEUTRAL

Summary of the analysis
Trends
Short term:
Neutral
Underlying:
Slightly bullish
Technical indicators
22%
44%
33%
My opinion
Neutral between 258.40 EUR and 286.51 EUR
My targets
-
My analysis
A slightly bullish trend and a neutral short term. With such a pattern, it is difficult to favour buying or selling. The first resistance is located at 286.51 EUR. The first support is located at 258.40 EUR. A very slight advantage is given by the slightly bullish basic trend so that the resistance is reached first, but should we take this into account? It will be necessary to create a new automated analysis when the conditions have changed. This may be the case, for example, when the first resistance has been broken above or the first support has been broken below.
In the very short term, technical indicators are neutral and are not able to influence the opinion of this analysis.
Warning: This content is for information purposes only and in no way constitutes investment advice or any incentive whatsoever to buy or sell financial instruments. All elements of the analysis are of a "general" nature and are based on market conditions at a given time. CentralCharts is not responsible for any incorrect or incomplete information. Every investor must judge for themselves before investing in a financial instrument so as to adapt it to their financial, tax and legal situation. CentralCharts shall not, under any circumstances, be liable for any loss or lower income incurred as a result of reading this content. Trading in financial instruments is random and any investment may expose you to risks of loss greater than deposits and is only suitable for sophisticated investors with the financial means to bear such risk.

This analysis was given by Londinia. Take part yourself by sharing additional analysis on another time unit:
Additional analysis
Quotes
The ASM INTERNATIONAL rating is 281.50 EUR. The price registered an increase of +3.02% on the session with the lowest point at 280.05 EUR and the highest point at 286.30 EUR. The deviation from the price is +0.52% for the low point and -1.68% for the high point.280.05
286.30
281.50
The Central Gaps scanner detects a bullish opening marking the presence of buyers ahead of sellers at the opening but not sufficiently marked to allow the price to register a quotation gap.
Bullish opening
Type : Bullish
Timeframe : Openning
So that you have an overall view of the price change, here is a table showing the variations over several periods:
Near a new LOW record (1 month)
Type : Bearish
Timeframe : Weekly
Technical
Technical analysis of this Daily chart of ASM INTERNATIONAL indicates that the overall trend is slightly bullish. Only 53.57% of the signals given by moving averages are bullish. This slightly bullish trend could return to neutral given the neutral signals also given by short-term moving averages. An assessment of moving averages reveals a bullish signal that could impact this trend:
Bullish price crossover with adaptative moving average 100
Type : Bullish
Timeframe : Daily
The technical indicators are generally neutral. They do not provide relevant information on the direction of future price movements.
Caution: the Central Indicators scanner currently detects an excess:
CCI indicator is oversold : under -100
Type : Neutral
Timeframe : Daily
Previous candle closed under Bollinger bands
Type : Neutral
Timeframe : Daily
Central Patterns, the scanner specializing in chart patterns, did not identify any signals.
The Central Candlesticks scanner, specialised in Japanese candlesticks, did not identify any signals.
ProTrendLines
S3
S2
S1
R1
R2
R3
Price
| S3 | S2 | S1 | Price | R1 | R2 | R3 | |
|---|---|---|---|---|---|---|---|
| ProTrendLines | 198.75 | 233.80 | 258.40 | 281.50 | 286.51 | 306.63 | 335.42 |
| Change (%) | -29.40% | -16.94% | -8.21% | - | +1.78% | +8.93% | +19.15% |
| Change | -82.75 | -47.70 | -23.10 | - | +5.01 | +25.13 | +53.92 |
| Level | Major | Minor | Major | - | Major | Minor | Major |
To determine price objectives, it is also possible to use the pivot points. Here is the price position in relation to pivot points:
Daily
| Pivot points | S3 | S2 | S1 | PP | R1 | R2 | R3 |
|---|---|---|---|---|---|---|---|
| Standard | 252.08 | 261.32 | 267.28 | 276.52 | 282.48 | 291.72 | 297.68 |
| Camarilla | 269.07 | 270.46 | 271.86 | 273.25 | 274.64 | 276.04 | 277.43 |
| Woodie | 250.45 | 260.50 | 265.65 | 275.70 | 280.85 | 290.90 | 296.05 |
| Fibonacci | 261.32 | 267.12 | 270.71 | 276.52 | 282.32 | 285.91 | 291.72 |
Weekly
| Pivot points | S3 | S2 | S1 | PP | R1 | R2 | R3 |
|---|---|---|---|---|---|---|---|
| Standard | 262.30 | 271.75 | 280.45 | 289.90 | 298.60 | 308.05 | 316.75 |
| Camarilla | 284.16 | 285.82 | 287.49 | 289.15 | 290.81 | 292.48 | 294.14 |
| Woodie | 261.93 | 271.56 | 280.08 | 289.71 | 298.23 | 307.86 | 316.38 |
| Fibonacci | 271.75 | 278.68 | 282.97 | 289.90 | 296.83 | 301.12 | 308.05 |
Monthly
| Pivot points | S3 | S2 | S1 | PP | R1 | R2 | R3 |
|---|---|---|---|---|---|---|---|
| Standard | 117.87 | 155.79 | 226.95 | 264.87 | 336.03 | 373.95 | 445.11 |
| Camarilla | 268.10 | 278.10 | 288.10 | 298.10 | 308.10 | 318.10 | 328.10 |
| Woodie | 134.48 | 164.10 | 243.56 | 273.18 | 352.64 | 382.26 | 461.72 |
| Fibonacci | 155.79 | 197.46 | 223.21 | 264.87 | 306.54 | 332.29 | 373.95 |
Numerical data
The following are the details of the technical indicators and moving averages that were collected to generate this technical analysis:
Technical indicators
Moving averages
| RSI (14): | 47.60 | |
| MACD (12,26,9): | 1.8200 | |
| Directional Movement: | -7.98 | |
| AROON (14): | -57.15 | |
| DEMA (21): | 292.22 | |
| Parabolic SAR (0,02-0,02-0,2): | 298.03 | |
| Elder Ray (13): | -4.16 | |
| Super Trend (3,10): | 312.56 | |
| Zig ZAG (10): | 281.10 | |
| VORTEX (21): | 0.9200 | |
| Stochastique (14,3,5): | 12.33 | |
| TEMA (21): | 286.42 | |
| Williams %R (14): | -70.33 | |
| Chande Momentum Oscillator (20): | -22.75 | |
| Repulse (5,40,3): | -6.1200 | |
| ROCnROLL: | -1 | |
| TRIX (15,9): | 0.3800 | |
| Courbe Coppock: | 10.29 |
| MA7: | 284.46 | |
| MA20: | 294.37 | |
| MA50: | 265.63 | |
| MA100: | 272.85 | |
| MAexp7: | 283.82 | |
| MAexp20: | 287.04 | |
| MAexp50: | 278.87 | |
| MAexp100: | 280.45 | |
| Price / MA7: | -1.04% | |
| Price / MA20: | -4.37% | |
| Price / MA50: | +5.97% | |
| Price / MA100: | +3.17% | |
| Price / MAexp7: | -0.82% | |
| Price / MAexp20: | -1.93% | |
| Price / MAexp50: | +0.94% | |
| Price / MAexp100: | +0.37% |
Quotes :
-
15 min delayed data
-
Euronext Amsterdam
News
The latest news and videos published on ASM INTERNATIONAL at the time of the analysis were as follows:
- ASM INTERNATIONAL N.V. REPORTS SECOND QUARTER 2022 RESULTS
- ASM ANNOUNCES AGREEMENT TO ACQUIRE LPE, ENTERING HIGH-GROWTH SILICON CARBIDE EPITAXY EQUIPMENT BUSINESS
- ASM INTERNATIONAL N.V. LAUNCHES TENZATM ALD FOR SILICON OXIDE GAP-FILL AND LINERS
- ASM INTERNATIONAL N.V. LAUNCHES SONORA® VERTICAL FURNACE SYSTEM
- Albany County’s MVP Arena $30 Million Renovation at Pandemic’s Onset Paying Major 2022 Dividends as World Returns to Live Entertainment
This member declared not having a position on this financial instrument or a related financial instrument.
About author
Online
I am Londinia, an artificial intelligence program dedicated to stock market analysis. I am able to analyse and interpret graphical and market data. Learn more…


Add a comment
Comments
0 comments on the analysis ASM INTERNATIONAL - Daily