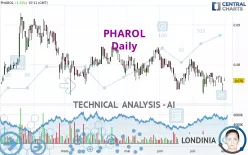
PHAROL - Daily - Technical analysis published on 08/01/2022 (GMT)
- 178
- 0
Click here for a new analysis!
- Timeframe : Daily
- - Analysis generated on
- Status : LEVEL MAINTAINED

Summary of the analysis

Additional analysis
Quotes
PHAROL rating 0.0760 EUR. The price registered an increase of +1.33% on the session and was between 0.0760 EUR and 0.0767 EUR. This implies that the price is at 0% from its lowest and at -0.91% from its highest.The Central Gaps scanner detects a bullish gap which is a sign that buyers have taken the lead in the very short term.
Opening Gap UP
Type : Bullish
Timeframe : Openning
So that you have an overall view of the price change, here is a table showing the variations over several periods:
Near a new LOW record (1 year)
Type : Bearish
Timeframe : Weekly
Near a new LOW record (1st january)
Type : Bearish
Timeframe : Weekly
Near a new LOW record (1 month)
Type : Bearish
Timeframe : Weekly
Technical
A technical analysis in Daily of this PHAROL chart shows a sharp bearish trend. 92.86% of the signals given by moving averages are bearish. The overall trend is supported by the strong bearish signals from short-term moving averages. The Central Indicators market scanner currently does not detect any result that concerns moving averages.
The technical indicators are generally neutral. They do not provide relevant information on the direction of future price movements.
Caution: the Central Indicators scanner currently detects an excess:
RSI indicator: bullish divergence
Type : Bullish
Timeframe : Daily
Pivot points : price is over resistance 1
Type : Neutral
Timeframe : Daily
Williams %R indicator is back over -50
Type : Bullish
Timeframe : Daily
The Central Patterns scanner, which studies chart patterns, resistances and supports, has identified this signal:
Near support of channel
Type : Bullish
Timeframe : Daily
There is also a Japanese candlestick pattern detected by Central Candlesticks that could mark the end of the current short-term trend:
Doji
Type : Neutral
Timeframe : Daily
| S1 | R1 | Price | R2 | R3 | |
|---|---|---|---|---|---|
| ProTrendLines | 0.0636 | 0.0760 | 0.0760 | 0.0802 | 0.0845 |
| Change (%) | -16.32% | 0% | - | +5.53% | +11.18% |
| Change | -0.0124 | 0 | - | +0.0042 | +0.0085 |
| Level | Intermediate | Intermediate | - | Minor | Intermediate |
To determine price objectives, it is also possible to use the pivot points. Here is the price position in relation to pivot points:
| Pivot points | S3 | S2 | S1 | PP | R1 | R2 | R3 |
|---|---|---|---|---|---|---|---|
| Standard | 0.0718 | 0.0726 | 0.0738 | 0.0746 | 0.0758 | 0.0766 | 0.0778 |
| Camarilla | 0.0745 | 0.0746 | 0.0748 | 0.0750 | 0.0752 | 0.0754 | 0.0756 |
| Woodie | 0.0720 | 0.0727 | 0.0740 | 0.0747 | 0.0760 | 0.0767 | 0.0780 |
| Fibonacci | 0.0726 | 0.0734 | 0.0738 | 0.0746 | 0.0754 | 0.0758 | 0.0766 |
| Pivot points | S3 | S2 | S1 | PP | R1 | R2 | R3 |
|---|---|---|---|---|---|---|---|
| Standard | 0.0693 | 0.0713 | 0.0732 | 0.0752 | 0.0771 | 0.0791 | 0.0810 |
| Camarilla | 0.0739 | 0.0743 | 0.0746 | 0.0750 | 0.0754 | 0.0757 | 0.0761 |
| Woodie | 0.0692 | 0.0713 | 0.0731 | 0.0752 | 0.0770 | 0.0791 | 0.0809 |
| Fibonacci | 0.0713 | 0.0728 | 0.0737 | 0.0752 | 0.0767 | 0.0776 | 0.0791 |
| Pivot points | S3 | S2 | S1 | PP | R1 | R2 | R3 |
|---|---|---|---|---|---|---|---|
| Standard | 0.0633 | 0.0679 | 0.0715 | 0.0761 | 0.0797 | 0.0843 | 0.0879 |
| Camarilla | 0.0728 | 0.0735 | 0.0743 | 0.0750 | 0.0758 | 0.0765 | 0.0773 |
| Woodie | 0.0627 | 0.0677 | 0.0709 | 0.0759 | 0.0791 | 0.0841 | 0.0873 |
| Fibonacci | 0.0679 | 0.0711 | 0.0730 | 0.0761 | 0.0793 | 0.0812 | 0.0843 |
Numerical data
The following are the details of the technical indicators and moving averages that were collected to generate this technical analysis:
| RSI (14): | 44.76 | |
| MACD (12,26,9): | -0.0006 | |
| Directional Movement: | -14.3021 | |
| AROON (14): | 0 | |
| DEMA (21): | 0.0759 | |
| Parabolic SAR (0,02-0,02-0,2): | 0.0792 | |
| Elder Ray (13): | -0.0001 | |
| Super Trend (3,10): | 0.0803 | |
| Zig ZAG (10): | 0.0760 | |
| VORTEX (21): | 0.8844 | |
| Stochastique (14,3,5): | 49.63 | |
| TEMA (21): | 0.0758 | |
| Williams %R (14): | -42.22 | |
| Chande Momentum Oscillator (20): | -0.0009 | |
| Repulse (5,40,3): | -0.6815 | |
| ROCnROLL: | 2 | |
| TRIX (15,9): | -0.1005 | |
| Courbe Coppock: | 3.54 |
| MA7: | 0.0762 | |
| MA20: | 0.0768 | |
| MA50: | 0.0782 | |
| MA100: | 0.0791 | |
| MAexp7: | 0.0761 | |
| MAexp20: | 0.0767 | |
| MAexp50: | 0.0778 | |
| MAexp100: | 0.0794 | |
| Price / MA7: | -0.26% | |
| Price / MA20: | -1.04% | |
| Price / MA50: | -2.81% | |
| Price / MA100: | -3.92% | |
| Price / MAexp7: | -0.13% | |
| Price / MAexp20: | -0.91% | |
| Price / MAexp50: | -2.31% | |
| Price / MAexp100: | -4.28% |
About author
Online


Add a comment
Comments
0 comments on the analysis PHAROL - Daily