BITCOIN FULL0725 - Daily - Technical analysis published on 10/21/2020 (GMT)
- 369
- 0
Click here for a new analysis!
- Timeframe : Daily
- - Analysis generated on
- Status : TARGET REACHED

Summary of the analysis

Additional analysis
Quotes
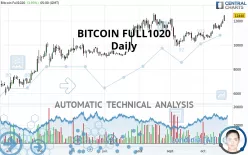
The BITCOIN FULL1020 price is 12,440 USD. The price registered an increase of +3.93% on the session and was between 11,960 USD and 12,475 USD. This implies that the price is at +4.01% from its lowest and at -0.28% from its highest.The Central Gaps scanner detects a bullish opening. A small advantage for buyers in the very short term.
Bullish opening
Type : Bullish
Timeframe : Openning
So that you have an overall view of the price change, here is a table showing the variations over several periods:
Near a new HIGH record (1st january)
Type : Bullish
Timeframe : Weekly
Technical
A technical analysis in Daily of this BITCOIN FULL1020 chart shows a strongly bullish trend. 89.29% of the signals given by moving averages are bullish. The overall trend is supported by the strong bullish signals from short-term moving averages. The Central Indicators market scanner is currently detecting a bullish signal that could impact this trend:
Bullish trend reversal : Moving Average 50
Type : Bullish
Timeframe : Daily
The probability of a further increase is high given the direction of the technical indicators.
Caution: the Central Indicators scanner currently detects an excess:
CCI indicator is overbought : over 100
Type : Neutral
Timeframe : Daily
Williams %R indicator is overbought : over -20
Type : Neutral
Timeframe : Daily
Pivot points : price is over resistance 2
Type : Neutral
Timeframe : Daily
Pivot points : price is over resistance 3
Type : Neutral
Timeframe : Weekly
No signals are given by Central Patterns, a market scanner specialised in chart patterns, resistances and supports.
No result was found by the Central Candlesticks scanner on Japanese candlesticks.
| S3 | S2 | S1 | Price | R1 | R2 | |
|---|---|---|---|---|---|---|
| ProTrendLines | 9,077 | 10,012 | 11,637 | 12,440 | 12,485 | 14,145 |
| Change (%) | -27.03% | -19.52% | -6.45% | - | +0.36% | +13.71% |
| Change | -3,363 | -2,428 | -803 | - | +45 | +1,705 |
| Level | Minor | Major | Major | - | Intermediate | Intermediate |
Pivot points can also be used to set your price objectives. Here is the price situation in relation to pivot points:
| Pivot points | S3 | S2 | S1 | PP | R1 | R2 | R3 |
|---|---|---|---|---|---|---|---|
| Standard | 11,400 | 11,570 | 11,770 | 11,940 | 12,140 | 12,310 | 12,510 |
| Camarilla | 11,868 | 11,902 | 11,936 | 11,970 | 12,004 | 12,038 | 12,072 |
| Woodie | 11,415 | 11,578 | 11,785 | 11,948 | 12,155 | 12,318 | 12,525 |
| Fibonacci | 11,570 | 11,711 | 11,799 | 11,940 | 12,081 | 12,169 | 12,310 |
| Pivot points | S3 | S2 | S1 | PP | R1 | R2 | R3 |
|---|---|---|---|---|---|---|---|
| Standard | 10,542 | 10,883 | 11,122 | 11,463 | 11,702 | 12,043 | 12,282 |
| Camarilla | 11,201 | 11,254 | 11,307 | 11,360 | 11,413 | 11,466 | 11,520 |
| Woodie | 10,490 | 10,858 | 11,070 | 11,438 | 11,650 | 12,018 | 12,230 |
| Fibonacci | 10,883 | 11,105 | 11,242 | 11,463 | 11,685 | 11,822 | 12,043 |
| Pivot points | S3 | S2 | S1 | PP | R1 | R2 | R3 |
|---|---|---|---|---|---|---|---|
| Standard | 7,280 | 8,565 | 9,605 | 10,890 | 11,930 | 13,215 | 14,255 |
| Camarilla | 10,006 | 10,219 | 10,432 | 10,645 | 10,858 | 11,071 | 11,284 |
| Woodie | 7,158 | 8,504 | 9,483 | 10,829 | 11,808 | 13,154 | 14,133 |
| Fibonacci | 8,565 | 9,453 | 10,002 | 10,890 | 11,778 | 12,327 | 13,215 |
Numerical data
The following is the status of technical indicators and moving averages registered at the time this technical analysis was created:
| RSI (14): | 68.00 | |
| MACD (12,26,9): | 281.0000 | |
| Directional Movement: | 20 | |
| AROON (14): | 93 | |
| DEMA (21): | 11,612 | |
| Parabolic SAR (0,02-0,02-0,2): | 11,027 | |
| Elder Ray (13): | 697 | |
| Super Trend (3,10): | 10,963 | |
| Zig ZAG (10): | 12,275 | |
| VORTEX (21): | 1.0000 | |
| Stochastique (14,3,5): | 92.00 | |
| TEMA (21): | 11,880 | |
| Williams %R (14): | -3.00 | |
| Chande Momentum Oscillator (20): | 1,535 | |
| Repulse (5,40,3): | 5.0000 | |
| ROCnROLL: | 1 | |
| TRIX (15,9): | 0.0000 | |
| Courbe Coppock: | 19.00 |
| MA7: | 11,707 | |
| MA20: | 11,156 | |
| MA50: | 11,161 | |
| MA100: | 10,567 | |
| MAexp7: | 11,780 | |
| MAexp20: | 11,318 | |
| MAexp50: | 11,023 | |
| MAexp100: | 10,555 | |
| Price / MA7: | +6.26% | |
| Price / MA20: | +11.51% | |
| Price / MA50: | +11.46% | |
| Price / MA100: | +17.72% | |
| Price / MAexp7: | +5.60% | |
| Price / MAexp20: | +9.91% | |
| Price / MAexp50: | +12.85% | |
| Price / MAexp100: | +17.86% |
About author

Online


Add a comment
Comments
0 comments on the analysis BITCOIN FULL0725 - Daily