| Open: | - |
| Change: | - |
| Volume: | - |
| Low: | - |
| High: | - |
| High / Low range: | - |
| Type: | Stocks |
| Ticker: | PSX |
| ISIN: |
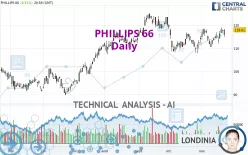
PHILLIPS 66 - Daily - Technical analysis published on 11/23/2023 (GMT)
- 186
- 0
- 11/23/2023 - 20:03
Click here for a new analysis!
- Timeframe : Daily
- - Analysis generated on 11/23/2023 - 20:03
- Status : TARGET REACHED

Summary of the analysis

Additional analysis
Quotes
The PHILLIPS 66 price is 118.01 USD. The price has increased by +0.51% since the last closing and was traded between 114.94 USD and 118.21 USD over the period. The price is currently at +2.67% from its lowest and -0.17% from its highest.A bearish gap was detected at the opening by the Central Gaps scanner. There are a lot of sellers and they have the upper hand in the very short term.
Opening Gap DOWN
Type : Bearish
Timeframe : Openning
So that you have an overall view of the price change, here is a table showing the variations over several periods:
Near a new HIGH record (5 years)
Type : Bullish
Timeframe : Weekly
Near a new HIGH record (1 year)
Type : Bullish
Timeframe : Weekly
Near a new HIGH record (1st january)
Type : Bullish
Timeframe : Weekly
Near a new HIGH record (1 month)
Type : Bullish
Timeframe : Weekly
Technical
A technical analysis in Daily of this PHILLIPS 66 chart shows a strongly bullish trend. 82.14% of the signals given by moving averages are bullish. The overall trend is supported by the strong bullish signals from short-term moving averages. The Central Indicators market scanner currently does not detect any result that concerns moving averages.
The probability of a further increase is high given the direction of the technical indicators.
Caution: the Central Indicators scanner currently detects an excess:
Williams %R indicator is overbought : over -20
Type : Neutral
Timeframe : Daily
Price is back over the pivot point
Type : Bullish
Timeframe : Daily
An analysis of the price chart with the Central Patterns scanner (detector of chart patterns and resistances and supports) shows several results that can have an impact on the price change:
Near resistance of channel
Type : Bearish
Timeframe : Daily
Near resistance of triangle
Type : Bearish
Timeframe : Daily
Near horizontal support
Type : Bullish
Timeframe : Daily
Central Candlesticks, the scanner specialised in Japanese candlesticks, detects a bullish signal that could support the hypothesis of a small rebound in the very short term:
Bullish engulfing lines
Type : Bullish
Timeframe : Daily
| S3 | S2 | S1 | Price | R1 | |
|---|---|---|---|---|---|
| ProTrendLines | 101.85 | 108.85 | 117.05 | 118.01 | 123.15 |
| Change (%) | -13.69% | -7.76% | -0.81% | - | +4.36% |
| Change | -16.16 | -9.16 | -0.96 | - | +5.14 |
| Level | Major | Major | Major | - | Major |
Attention could also be paid to pivot points to set price objectives:
| Pivot points | S3 | S2 | S1 | PP | R1 | R2 | R3 |
|---|---|---|---|---|---|---|---|
| Standard | 112.63 | 113.78 | 115.90 | 117.05 | 119.17 | 120.32 | 122.44 |
| Camarilla | 117.11 | 117.41 | 117.71 | 118.01 | 118.31 | 118.61 | 118.91 |
| Woodie | 113.11 | 114.02 | 116.38 | 117.29 | 119.65 | 120.56 | 122.92 |
| Fibonacci | 113.78 | 115.03 | 115.80 | 117.05 | 118.30 | 119.07 | 120.32 |
| Pivot points | S3 | S2 | S1 | PP | R1 | R2 | R3 |
|---|---|---|---|---|---|---|---|
| Standard | 107.57 | 109.74 | 113.05 | 115.22 | 118.53 | 120.70 | 124.01 |
| Camarilla | 114.86 | 115.37 | 115.87 | 116.37 | 116.87 | 117.38 | 117.88 |
| Woodie | 108.15 | 110.03 | 113.63 | 115.51 | 119.11 | 120.99 | 124.59 |
| Fibonacci | 109.74 | 111.83 | 113.12 | 115.22 | 117.31 | 118.60 | 120.70 |
| Pivot points | S3 | S2 | S1 | PP | R1 | R2 | R3 |
|---|---|---|---|---|---|---|---|
| Standard | 94.52 | 100.70 | 106.86 | 113.04 | 119.20 | 125.38 | 131.54 |
| Camarilla | 109.64 | 110.77 | 111.90 | 113.03 | 114.16 | 115.29 | 116.42 |
| Woodie | 94.52 | 100.70 | 106.86 | 113.04 | 119.20 | 125.38 | 131.54 |
| Fibonacci | 100.70 | 105.41 | 108.32 | 113.04 | 117.75 | 120.66 | 125.38 |
Numerical data
The following is the status of technical indicators and moving averages registered at the time this technical analysis was created:
| RSI (14): | 60.65 | |
| MACD (12,26,9): | 1.0200 | |
| Directional Movement: | 4.94 | |
| AROON (14): | 50.00 | |
| DEMA (21): | 115.54 | |
| Parabolic SAR (0,02-0,02-0,2): | 111.93 | |
| Elder Ray (13): | 1.41 | |
| Super Trend (3,10): | 109.83 | |
| Zig ZAG (10): | 118.01 | |
| VORTEX (21): | 1.0400 | |
| Stochastique (14,3,5): | 87.63 | |
| TEMA (21): | 116.66 | |
| Williams %R (14): | -10.61 | |
| Chande Momentum Oscillator (20): | 2.22 | |
| Repulse (5,40,3): | 4.1700 | |
| ROCnROLL: | 1 | |
| TRIX (15,9): | 0.0400 | |
| Courbe Coppock: | 4.56 |
| MA7: | 115.98 | |
| MA20: | 113.88 | |
| MA50: | 114.45 | |
| MA100: | 111.68 | |
| MAexp7: | 116.26 | |
| MAexp20: | 114.55 | |
| MAexp50: | 113.52 | |
| MAexp100: | 110.93 | |
| Price / MA7: | +1.75% | |
| Price / MA20: | +3.63% | |
| Price / MA50: | +3.11% | |
| Price / MA100: | +5.67% | |
| Price / MAexp7: | +1.51% | |
| Price / MAexp20: | +3.02% | |
| Price / MAexp50: | +3.96% | |
| Price / MAexp100: | +6.38% |
News
Don't forget to follow the news on PHILLIPS 66. At the time of publication of this analysis, the latest news was as follows:
- 11/02/2023 - 17:49 Phillips 66® Continues Bedlam Series Partnership with Dustin Lynch's Free Pre-Game Concert Celebrating Rivalry and Debut of Phillips 66® GO GO GO Campaign
- 08/02/2023 - 11:00 Phillips 66 Reports Second-Quarter 2023 Financial Results
- 07/12/2023 - 20:30 Phillips 66 Announces Quarterly Dividend
- 06/29/2023 - 13:00 Phillips 66 Highlights Resiliency in 2023 Sustainability Report
- 06/19/2023 - 20:45 Phillips 66 to Announce Second-Quarter Financial Results
About author

Online


Add a comment
Comments
0 comments on the analysis PHILLIPS 66 - Daily