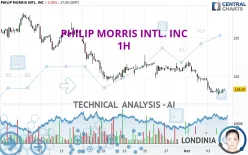
PHILIP MORRIS INTL. INC - 1H - Technical analysis published on 10/04/2024 (GMT)
- 259
- 0
Click here for a new analysis!
- Timeframe : 1H
- - Analysis generated on
- Status : LEVEL MAINTAINED

Summary of the analysis

Additional analysis
Quotes
The PHILIP MORRIS INTL. INC rating is 118.29 USD. On the day, this instrument lost -0.08% and was traded between 117.53 USD and 118.51 USD over the period. The price is currently at +0.65% from its lowest and -0.19% from its highest.The Central Gaps scanner detects the formation of a bearish gap marking the strong presence of sellers ahead of buyers at the opening. This formed a quotation gap.
Opening Gap DOWN
Type : Bearish
Timeframe : Openning
So that you have an overall view of the price change, here is a table showing the variations over several periods:
Near a new HIGH record (5 years)
Type : Bullish
Timeframe : Weekly
New LOW record (1 month)
Type : Bearish
Timeframe : Weekly
Technical
A technical analysis in 1H of this PHILIP MORRIS INTL. INC chart shows a sharp bearish trend. 92.86% of the signals given by moving averages are bearish. This strongly bearish trend is supported by the strong bearish signals given by short-term moving averages. The Central Indicators market scanner is currently detecting a bearish signal that could impact this trend:
Bearish price crossover with adaptative moving average 20
Type : Bearish
Timeframe : 1 hour
In fact, Central Analyzer took into account 18 technical indicators and the result was as follows: 6 are bullish, 3 are neutral and 9 are bearish. Central Indicators, the scanner specialised in technical indicators, has identified this signal:
Pivot points : price is under support 1
Type : Neutral
Timeframe : Weekly
The Central Patterns scanner, which studies chart patterns, resistances and supports, has identified these signals:
Near horizontal resistance
Type : Bearish
Timeframe : 1 hour
Near support of channel
Type : Bullish
Timeframe : 1 hour
For a small setback in the very short term, the Central Candlesticks scanner currently notes the presence of this bearish pattern in Japanese candlesticks:
Bearish harami
Type : Bearish
Timeframe : 1 hour
Bearish harami cross
Type : Bearish
Timeframe : 1 hour
| S3 | S2 | S1 | Price | R1 | R2 | R3 | |
|---|---|---|---|---|---|---|---|
| ProTrendLines | 84.85 | 92.74 | 99.47 | 118.29 | 118.41 | 120.25 | 121.95 |
| Change (%) | -28.27% | -21.60% | -15.91% | - | +0.10% | +1.66% | +3.09% |
| Change | -33.44 | -25.55 | -18.82 | - | +0.12 | +1.96 | +3.66 |
| Level | Major | Intermediate | Major | - | Major | Minor | Major |
To determine price objectives, it is also possible to use the pivot points. Here is the price position in relation to pivot points:
| Pivot points | S3 | S2 | S1 | PP | R1 | R2 | R3 |
|---|---|---|---|---|---|---|---|
| Standard | 115.79 | 116.79 | 117.59 | 118.59 | 119.39 | 120.39 | 121.19 |
| Camarilla | 117.89 | 118.05 | 118.22 | 118.38 | 118.55 | 118.71 | 118.88 |
| Woodie | 115.68 | 116.74 | 117.48 | 118.54 | 119.28 | 120.34 | 121.08 |
| Fibonacci | 116.79 | 117.48 | 117.91 | 118.59 | 119.28 | 119.71 | 120.39 |
| Pivot points | S3 | S2 | S1 | PP | R1 | R2 | R3 |
|---|---|---|---|---|---|---|---|
| Standard | 116.43 | 117.61 | 119.12 | 120.30 | 121.81 | 122.99 | 124.50 |
| Camarilla | 119.88 | 120.13 | 120.37 | 120.62 | 120.87 | 121.11 | 121.36 |
| Woodie | 116.59 | 117.69 | 119.28 | 120.38 | 121.97 | 123.07 | 124.66 |
| Fibonacci | 117.61 | 118.64 | 119.28 | 120.30 | 121.33 | 121.97 | 122.99 |
| Pivot points | S3 | S2 | S1 | PP | R1 | R2 | R3 |
|---|---|---|---|---|---|---|---|
| Standard | 108.27 | 113.05 | 117.23 | 122.01 | 126.19 | 130.97 | 135.15 |
| Camarilla | 118.94 | 119.76 | 120.58 | 121.40 | 122.22 | 123.04 | 123.86 |
| Woodie | 107.96 | 112.90 | 116.92 | 121.86 | 125.88 | 130.82 | 134.84 |
| Fibonacci | 113.05 | 116.48 | 118.59 | 122.01 | 125.44 | 127.55 | 130.97 |
Numerical data
The following are the details of the technical indicators and moving averages that were collected to generate this technical analysis:
| RSI (14): | 35.15 | |
| MACD (12,26,9): | -0.6400 | |
| Directional Movement: | -11.96 | |
| AROON (14): | -57.14 | |
| DEMA (21): | 117.93 | |
| Parabolic SAR (0,02-0,02-0,2): | 118.48 | |
| Elder Ray (13): | -0.20 | |
| Super Trend (3,10): | 119.55 | |
| Zig ZAG (10): | 118.16 | |
| VORTEX (21): | 0.7600 | |
| Stochastique (14,3,5): | 25.46 | |
| TEMA (21): | 117.62 | |
| Williams %R (14): | -66.96 | |
| Chande Momentum Oscillator (20): | -1.33 | |
| Repulse (5,40,3): | 0.2500 | |
| ROCnROLL: | 2 | |
| TRIX (15,9): | -0.0800 | |
| Courbe Coppock: | 2.74 |
| MA7: | 119.98 | |
| MA20: | 121.31 | |
| MA50: | 119.11 | |
| MA100: | 110.13 | |
| MAexp7: | 118.20 | |
| MAexp20: | 118.76 | |
| MAexp50: | 119.60 | |
| MAexp100: | 120.21 | |
| Price / MA7: | -1.41% | |
| Price / MA20: | -2.49% | |
| Price / MA50: | -0.69% | |
| Price / MA100: | +7.41% | |
| Price / MAexp7: | +0.08% | |
| Price / MAexp20: | -0.40% | |
| Price / MAexp50: | -1.10% | |
| Price / MAexp100: | -1.60% |
News
Don't forget to follow the news on PHILIP MORRIS INTL. INC. At the time of publication of this analysis, the latest news was as follows:
-
 Philip Morris Q4 forecasts disappoint
- Philip Morris International Reports 2023 Second-Quarter and First-Half Results
- Philip Morris International to Host Webcast of 2023 Second-Quarter and First-Half Results
- New Study by KPMG Reveals Alarming Levels of Illicit Cigarettes in the EU, with France Accounting for Almost Half of the Consumption
- Philip Morris International Publishes First Human Rights Report
About author
Online


Add a comment
Comments
0 comments on the analysis PHILIP MORRIS INTL. INC - 1H