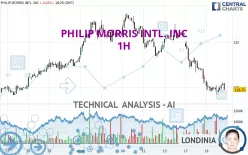
PHILIP MORRIS INTL. INC - 1H - Technical analysis published on 09/20/2024 (GMT)
- 171
- 0
Click here for a new analysis!
- Timeframe : 1H
- - Analysis generated on
- Status : LEVEL MAINTAINED

Summary of the analysis

Additional analysis
Quotes
PHILIP MORRIS INTL. INC rating 119.72 USD. The price is lower by -0.02% since the last closing and was between 119.16 USD and 120.57 USD. This implies that the price is at +0.47% from its lowest and at -0.70% from its highest.A study of price movements over other periods shows the following variations:
Near a new HIGH record (5 years)
Type : Bullish
Timeframe : Weekly
Near a new LOW record (1 month)
Type : Bearish
Timeframe : Weekly
Technical
Technical analysis of PHILIP MORRIS INTL. INC in 1H shows a overall strongly bearish trend. 92.86% of the signals given by moving averages are bearish. The overall trend is supported by the strong bearish signals from short-term moving averages. The Central Indicators market scanner is currently detecting a bearish signal that could impact this trend:
Bearish price crossover with adaptative moving average 20
Type : Bearish
Timeframe : 1 hour
The technical indicators are generally neutral. They do not provide relevant information on the direction of future price movements.
Other results related to technical indicators were also found by the Central Indicators scanner:
Pivot points : price is under support 3
Type : Neutral
Timeframe : Weekly
Price is back under the pivot point
Type : Bearish
Timeframe : 1 hour
An analysis of the price chart with the Central Patterns scanner (detector of chart patterns and resistances and supports) shows a result that can have an impact on the price change:
Near support of channel
Type : Bullish
Timeframe : 1 hour
For a small setback in the very short term, the Central Candlesticks scanner currently notes the presence of this bearish pattern in Japanese candlesticks:
Black evening star
Type : Bearish
Timeframe : 1 hour
| S3 | S2 | S1 | Price | R1 | R2 | R3 | |
|---|---|---|---|---|---|---|---|
| ProTrendLines | 116.64 | 117.82 | 119.10 | 119.72 | 120.24 | 123.28 | 125.00 |
| Change (%) | -2.57% | -1.59% | -0.52% | - | +0.43% | +2.97% | +4.41% |
| Change | -3.08 | -1.90 | -0.62 | - | +0.52 | +3.56 | +5.28 |
| Level | Minor | Intermediate | Intermediate | - | Minor | Major | Minor |
To determine price objectives, it is also possible to use the pivot points. Here is the price position in relation to pivot points:
| Pivot points | S3 | S2 | S1 | PP | R1 | R2 | R3 |
|---|---|---|---|---|---|---|---|
| Standard | 117.83 | 118.61 | 119.18 | 119.96 | 120.53 | 121.31 | 121.88 |
| Camarilla | 119.37 | 119.49 | 119.62 | 119.74 | 119.86 | 119.99 | 120.11 |
| Woodie | 117.72 | 118.56 | 119.07 | 119.91 | 120.42 | 121.26 | 121.77 |
| Fibonacci | 118.61 | 119.13 | 119.45 | 119.96 | 120.48 | 120.80 | 121.31 |
| Pivot points | S3 | S2 | S1 | PP | R1 | R2 | R3 |
|---|---|---|---|---|---|---|---|
| Standard | 118.29 | 120.79 | 123.21 | 125.71 | 128.13 | 130.63 | 133.05 |
| Camarilla | 124.27 | 124.72 | 125.17 | 125.62 | 126.07 | 126.52 | 126.97 |
| Woodie | 118.24 | 120.77 | 123.16 | 125.69 | 128.08 | 130.61 | 133.00 |
| Fibonacci | 120.79 | 122.67 | 123.83 | 125.71 | 127.59 | 128.75 | 130.63 |
| Pivot points | S3 | S2 | S1 | PP | R1 | R2 | R3 |
|---|---|---|---|---|---|---|---|
| Standard | 106.18 | 109.66 | 116.48 | 119.96 | 126.78 | 130.26 | 137.08 |
| Camarilla | 120.46 | 121.40 | 122.35 | 123.29 | 124.23 | 125.18 | 126.12 |
| Woodie | 107.84 | 110.50 | 118.14 | 120.80 | 128.44 | 131.10 | 138.74 |
| Fibonacci | 109.66 | 113.60 | 116.03 | 119.96 | 123.90 | 126.33 | 130.26 |
Numerical data
The following are the details of the technical indicators and moving averages that were collected to generate this technical analysis:
| RSI (14): | 33.44 | |
| MACD (12,26,9): | -0.9800 | |
| Directional Movement: | -20.51 | |
| AROON (14): | -64.29 | |
| DEMA (21): | 119.38 | |
| Parabolic SAR (0,02-0,02-0,2): | 119.24 | |
| Elder Ray (13): | -0.13 | |
| Super Trend (3,10): | 121.81 | |
| Zig ZAG (10): | 119.77 | |
| VORTEX (21): | 0.7700 | |
| Stochastique (14,3,5): | 35.53 | |
| TEMA (21): | 119.26 | |
| Williams %R (14): | -74.13 | |
| Chande Momentum Oscillator (20): | -0.43 | |
| Repulse (5,40,3): | -0.5200 | |
| ROCnROLL: | 2 | |
| TRIX (15,9): | -0.1400 | |
| Courbe Coppock: | 2.69 |
| MA7: | 122.84 | |
| MA20: | 123.76 | |
| MA50: | 117.80 | |
| MA100: | 108.87 | |
| MAexp7: | 119.99 | |
| MAexp20: | 120.77 | |
| MAexp50: | 122.39 | |
| MAexp100: | 122.95 | |
| Price / MA7: | -2.54% | |
| Price / MA20: | -3.26% | |
| Price / MA50: | +1.63% | |
| Price / MA100: | +9.97% | |
| Price / MAexp7: | -0.23% | |
| Price / MAexp20: | -0.87% | |
| Price / MAexp50: | -2.18% | |
| Price / MAexp100: | -2.63% |
News
The last news published on PHILIP MORRIS INTL. INC at the time of the generation of this analysis was as follows:
-
 Philip Morris Q4 forecasts disappoint
- Philip Morris International Reports 2023 Second-Quarter and First-Half Results
- Philip Morris International to Host Webcast of 2023 Second-Quarter and First-Half Results
- New Study by KPMG Reveals Alarming Levels of Illicit Cigarettes in the EU, with France Accounting for Almost Half of the Consumption
- Philip Morris International Publishes First Human Rights Report
About author
Online


Add a comment
Comments
0 comments on the analysis PHILIP MORRIS INTL. INC - 1H