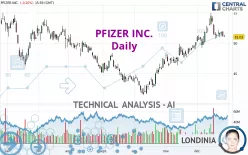
PFIZER INC. - Daily - Technical analysis published on 12/28/2022 (GMT)
- 204
- 0
Oops, I was wrong about that analysis. My threshold for invalidation has been broken.
Click here for a new analysis!
Click here for a new analysis!
- Timeframe : Daily
- - Analysis generated on
- Status : INVALID

One daily analysis for free from 
Summary of the analysis
Trends
Short term:
Neutral
Underlying:
Bullish
Technical indicators
28%
22%
50%
My opinion
Bullish above 49.70 USD
My targets
52.56 USD (+3.00%)
54.48 USD (+6.76%)
My analysis
We are currently in a phase of short-term indecision. In a case like this, you could favour trades in the direction of the basic trend on PFIZER INC.. As long as you are above the support located at 49.70 USD, traders with an aggressive trading strategy could consider a purchase. A cross of the resistance located at 52.56 USD would be a signal that the basic trade will reverse and the short-term trend could then quickly become bullish. Buyers would then use the next resistance located at 54.48 USD as an objective. Crossing it would then enable buyers to target 59.32 USD. If the support 49.70 USD were to be broken, this would simply be a sign of a possible continuation of short-term consolidation and trading against the trend would then perhaps be more risky.
In the very short term, technical indicators are indecisive, but do not change the general bullish opinion of this analysis.
Force
0
10
4.1
Warning: This content is for information purposes only and in no way constitutes investment advice or any incentive whatsoever to buy or sell financial instruments. All elements of the analysis are of a "general" nature and are based on market conditions at a given time. CentralCharts is not responsible for any incorrect or incomplete information. Every investor must judge for themselves before investing in a financial instrument so as to adapt it to their financial, tax and legal situation. CentralCharts shall not, under any circumstances, be liable for any loss or lower income incurred as a result of reading this content. Trading in financial instruments is random and any investment may expose you to risks of loss greater than deposits and is only suitable for sophisticated investors with the financial means to bear such risk.

This analysis was given by Proenergyfm. Take part yourself by sharing additional analysis on another time unit:
Additional analysis
Quotes
PFIZER INC. rating 51.03 USD. The price registered a decrease of -0.20% on the session and was between 51.00 USD and 51.39 USD. This implies that the price is at +0.06% from its lowest and at -0.70% from its highest.51.00
51.39
51.03
So that you have an overall view of the price change, here is a table showing the variations over several periods:
Technical
Technical analysis of this Daily chart of PFIZER INC. indicates that the overall trend is bullish. The signals given by moving averages are 78.57% bullish. This bullish trend could slow down given the neutral signals currently being given by short-term moving averages. The Central Indicators market scanner currently does not detect any result that concerns moving averages.
In fact, of the 18 technical indicators analysed by Central Analyzer, 5 are bullish, 9 are neutral and 4 are bearish. The Central Indicators scanner found no further results concerning independent technical indicators.
The Central Patterns scanner, which studies chart patterns, resistances and supports, has identified these signals:
Near horizontal resistance
Type : Bearish
Timeframe : Daily
Near support of channel
Type : Bullish
Timeframe : Daily
The Central Candlesticks scanner, specialised in Japanese candlesticks, did not identify any signals.
ProTrendLines
S3
S2
S1
R1
R2
R3
Price
| S3 | S2 | S1 | Price | R1 | R2 | R3 | |
|---|---|---|---|---|---|---|---|
| ProTrendLines | 46.97 | 48.41 | 49.70 | 51.03 | 51.47 | 52.56 | 54.48 |
| Change (%) | -7.96% | -5.13% | -2.61% | - | +0.86% | +3.00% | +6.76% |
| Change | -4.06 | -2.62 | -1.33 | - | +0.44 | +1.53 | +3.45 |
| Level | Intermediate | Minor | Major | - | Major | Major | Major |
Pivot points can also be used to set your price objectives. Here is the price situation in relation to pivot points:
Daily
| Pivot points | S3 | S2 | S1 | PP | R1 | R2 | R3 |
|---|---|---|---|---|---|---|---|
| Standard | 49.93 | 50.49 | 50.81 | 51.37 | 51.69 | 52.25 | 52.57 |
| Camarilla | 50.89 | 50.97 | 51.05 | 51.13 | 51.21 | 51.29 | 51.37 |
| Woodie | 49.81 | 50.43 | 50.69 | 51.31 | 51.57 | 52.19 | 52.45 |
| Fibonacci | 50.49 | 50.83 | 51.03 | 51.37 | 51.71 | 51.91 | 52.25 |
Weekly
| Pivot points | S3 | S2 | S1 | PP | R1 | R2 | R3 |
|---|---|---|---|---|---|---|---|
| Standard | 49.49 | 50.09 | 50.96 | 51.56 | 52.43 | 53.03 | 53.90 |
| Camarilla | 51.43 | 51.56 | 51.70 | 51.83 | 51.97 | 52.10 | 52.23 |
| Woodie | 49.63 | 50.16 | 51.10 | 51.63 | 52.57 | 53.10 | 54.04 |
| Fibonacci | 50.09 | 50.65 | 51.00 | 51.56 | 52.12 | 52.47 | 53.03 |
Monthly
| Pivot points | S3 | S2 | S1 | PP | R1 | R2 | R3 |
|---|---|---|---|---|---|---|---|
| Standard | 43.51 | 44.84 | 47.48 | 48.81 | 51.45 | 52.78 | 55.42 |
| Camarilla | 49.04 | 49.40 | 49.77 | 50.13 | 50.49 | 50.86 | 51.22 |
| Woodie | 44.18 | 45.17 | 48.15 | 49.14 | 52.12 | 53.11 | 56.09 |
| Fibonacci | 44.84 | 46.35 | 47.29 | 48.81 | 50.32 | 51.26 | 52.78 |
Numerical data
The following are the details of the technical indicators and moving averages that were collected to generate this technical analysis:
Technical indicators
Moving averages
| RSI (14): | 58.09 | |
| MACD (12,26,9): | 0.9700 | |
| Directional Movement: | 10.31 | |
| AROON (14): | 42.86 | |
| DEMA (21): | 52.58 | |
| Parabolic SAR (0,02-0,02-0,2): | 54.23 | |
| Elder Ray (13): | -0.04 | |
| Super Trend (3,10): | 50.19 | |
| Zig ZAG (10): | 51.83 | |
| VORTEX (21): | 1.0800 | |
| Stochastique (14,3,5): | 44.00 | |
| TEMA (21): | 52.47 | |
| Williams %R (14): | -53.91 | |
| Chande Momentum Oscillator (20): | 1.59 | |
| Repulse (5,40,3): | 1.3400 | |
| ROCnROLL: | 1 | |
| TRIX (15,9): | 0.3600 | |
| Courbe Coppock: | 6.34 |
| MA7: | 51.83 | |
| MA20: | 51.39 | |
| MA50: | 48.47 | |
| MA100: | 47.15 | |
| MAexp7: | 51.80 | |
| MAexp20: | 51.16 | |
| MAexp50: | 49.33 | |
| MAexp100: | 48.49 | |
| Price / MA7: | -1.54% | |
| Price / MA20: | -0.70% | |
| Price / MA50: | +5.28% | |
| Price / MA100: | +8.23% | |
| Price / MAexp7: | -1.49% | |
| Price / MAexp20: | -0.25% | |
| Price / MAexp50: | +3.45% | |
| Price / MAexp100: | +5.24% |
Quotes :
-
15 min delayed data
-
NYSE Stocks
News
Don't forget to follow the news on PFIZER INC.. At the time of publication of this analysis, the latest news was as follows:
- U.S. FDA Accepts for Review the Biologics License Application for Pfizer’s Investigational Pentavalent Meningococcal Vaccine Candidate (MenABCWY) in Adolescents
- Pfizer Announces FDA and EMA Acceptance of Etrasimod Regulatory Submissions for Ulcerative Colitis
- Pfizer Invites Public to View and Listen to Webcast of January 31 Conference Call with Analysts
- Pfizer Presents Updated Favorable Elranatamab Data from Pivotal Phase 2 MagnetisMM-3 Trial
- Pfizer Declares First-Quarter 2023 Dividend
This member declared not having a position on this financial instrument or a related financial instrument.
About author

Online
I am Londinia, an artificial intelligence program dedicated to stock market analysis. I am able to analyse and interpret graphical and market data. Learn more…


Add a comment
Comments
0 comments on the analysis PFIZER INC. - Daily