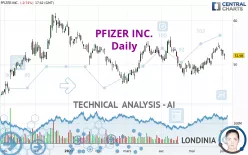
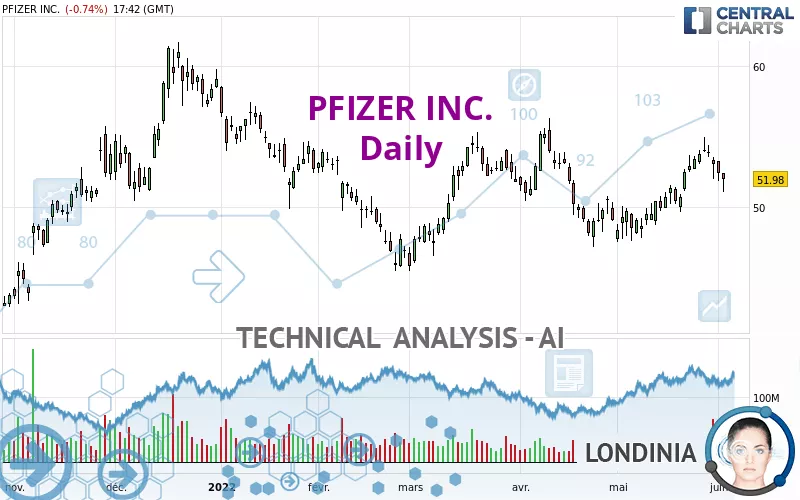
PFIZER INC. - Daily - Technical analysis published on 06/02/2022 (GMT)
- 297
- 0
Click here for a new analysis!
- Timeframe : Daily
- - Analysis generated on
- Status : INVALID
Summary of the analysis

Additional analysis
Quotes
PFIZER INC. rating 51.98 USD. The price is lower by -0.75% since the last closing and was traded between 51.04 USD and 52.37 USD over the period. The price is currently at +1.84% from its lowest and -0.74% from its highest.Here is a more detailed summary of the historical variations registered by PFIZER INC.:
Near a new HIGH record (1 month)
Type : Bullish
Timeframe : Weekly
Technical
Technical analysis of this Daily chart of PFIZER INC. indicates that the overall trend is bullish. 75.00% of the signals given by moving averages are bullish. This bullish trend is supported by the strong bullish signals given by short-term moving averages. An assessment of moving averages reveals a bullish signal that could impact this trend:
Moving Average bullish crossovers : MA20 & MA50
Type : Bullish
Timeframe : Daily
The probability of a further increase is slight given the direction of the technical indicators.
Central Indicators, the detector scanner for these technical indicators has recently detected several signals:
Pivot points : price is under support 1
Type : Neutral
Timeframe : Weekly
Williams %R indicator is back under -50
Type : Bearish
Timeframe : Daily
An analysis of the price chart with the Central Patterns scanner (detector of chart patterns and resistances and supports) shows several results that can have an impact on the price change:
Near horizontal support
Type : Bullish
Timeframe : Daily
Near support of channel
Type : Bullish
Timeframe : Daily
Near support of triangle
Type : Bullish
Timeframe : Daily
There is also a Japanese candlestick pattern detected by Central Candlesticks that could mark the end of the current short-term trend:
Black hanging man / hammer
Type : Neutral
Timeframe : Daily
| S3 | S2 | S1 | Price | R1 | R2 | R3 | |
|---|---|---|---|---|---|---|---|
| ProTrendLines | 45.38 | 47.78 | 50.62 | 51.98 | 54.72 | 58.13 | 60.30 |
| Change (%) | -12.70% | -8.08% | -2.62% | - | +5.27% | +11.83% | +16.01% |
| Change | -6.60 | -4.20 | -1.36 | - | +2.74 | +6.15 | +8.32 |
| Level | Major | Intermediate | Major | - | Major | Minor | Major |
Attention could also be paid to pivot points to set price objectives:
| Pivot points | S3 | S2 | S1 | PP | R1 | R2 | R3 |
|---|---|---|---|---|---|---|---|
| Standard | 50.26 | 51.04 | 51.71 | 52.49 | 53.16 | 53.94 | 54.61 |
| Camarilla | 51.97 | 52.10 | 52.24 | 52.37 | 52.50 | 52.64 | 52.77 |
| Woodie | 50.20 | 51.01 | 51.65 | 52.46 | 53.10 | 53.91 | 54.55 |
| Fibonacci | 51.04 | 51.60 | 51.94 | 52.49 | 53.05 | 53.39 | 53.94 |
| Pivot points | S3 | S2 | S1 | PP | R1 | R2 | R3 |
|---|---|---|---|---|---|---|---|
| Standard | 50.18 | 51.33 | 52.62 | 53.77 | 55.06 | 56.21 | 57.50 |
| Camarilla | 53.24 | 53.46 | 53.69 | 53.91 | 54.13 | 54.36 | 54.58 |
| Woodie | 50.25 | 51.37 | 52.69 | 53.81 | 55.13 | 56.25 | 57.57 |
| Fibonacci | 51.33 | 52.26 | 52.84 | 53.77 | 54.70 | 55.28 | 56.21 |
| Pivot points | S3 | S2 | S1 | PP | R1 | R2 | R3 |
|---|---|---|---|---|---|---|---|
| Standard | 40.60 | 43.84 | 48.44 | 51.68 | 56.28 | 59.52 | 64.12 |
| Camarilla | 50.88 | 51.60 | 52.32 | 53.04 | 53.76 | 54.48 | 55.20 |
| Woodie | 41.28 | 44.18 | 49.12 | 52.02 | 56.96 | 59.86 | 64.80 |
| Fibonacci | 43.84 | 46.84 | 48.69 | 51.68 | 54.68 | 56.53 | 59.52 |
Numerical data
The following are the details of the technical indicators and moving averages that were collected to generate this technical analysis:
| RSI (14): | 52.93 | |
| MACD (12,26,9): | 0.7900 | |
| Directional Movement: | 0.70 | |
| AROON (14): | 71.43 | |
| DEMA (21): | 52.68 | |
| Parabolic SAR (0,02-0,02-0,2): | 54.74 | |
| Elder Ray (13): | -0.52 | |
| Super Trend (3,10): | 50.36 | |
| Zig ZAG (10): | 51.98 | |
| VORTEX (21): | 1.0900 | |
| Stochastique (14,3,5): | 57.75 | |
| TEMA (21): | 53.37 | |
| Williams %R (14): | -55.82 | |
| Chande Momentum Oscillator (20): | 1.27 | |
| Repulse (5,40,3): | -0.5900 | |
| ROCnROLL: | -1 | |
| TRIX (15,9): | 0.1800 | |
| Courbe Coppock: | 14.25 |
| MA7: | 53.20 | |
| MA20: | 51.21 | |
| MA50: | 51.07 | |
| MA100: | 50.99 | |
| MAexp7: | 52.64 | |
| MAexp20: | 51.77 | |
| MAexp50: | 51.13 | |
| MAexp100: | 50.68 | |
| Price / MA7: | -2.29% | |
| Price / MA20: | +1.50% | |
| Price / MA50: | +1.78% | |
| Price / MA100: | +1.94% | |
| Price / MAexp7: | -1.25% | |
| Price / MAexp20: | +0.41% | |
| Price / MAexp50: | +1.66% | |
| Price / MAexp100: | +2.57% |
News
Don't forget to follow the news on PFIZER INC.. At the time of publication of this analysis, the latest news was as follows:
- Pfizer Provides Update on Ownership Interest in Haleon
- Pfizer Invites Public to View and Listen to a Webcast of Pfizer Discussion on Expanding Access & Affordability
- Pfizer Granted FDA Fast Track Designation for Ervogastat/Clesacostat Combination for the Treatment of Non-Alcoholic Steatohepatitis (NASH)
- Pfizer Invites Public to View and Listen to Webcast of Pfizer Discussion at Healthcare Conference
- Pfizer Launches ‘An Accord for a Healthier World’ to Improve Health Equity for 1.2 Billion People Living in 45 Lower-Income Countries
About author

Online


Add a comment
Comments
0 comments on the analysis PFIZER INC. - Daily