| Open: | 0.003194 |
| Change: | -0.000043 |
| Volume: | 122 |
| Low: | 0.003190 |
| High: | 0.003264 |
| High / Low range: | 0.000074 |
| Type: | Stocks |
| Ticker: | DNLI |
| ISIN: |
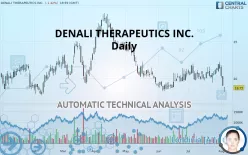
DENALI THERAPEUTICS INC. - Daily - Technical analysis published on 08/06/2019 (GMT)
- 308
- 0
- 08/06/2019 - 13:21
- Who voted?
Click here for a new analysis!
- Timeframe : Daily
- - Analysis generated on 08/06/2019 - 13:20
- Status : TARGET REACHED

Summary of the analysis

Additional analysis
Quotes
DENALI THERAPEUTICS INC. rating 18.75 USD. The price registered a decrease of -1.42% on the session and was between 18.19 USD and 18.87 USD. This implies that the price is at +3.08% from its lowest and at -0.64% from its highest.The Central Gaps scanner detects the formation of a bearish gap marking the strong presence of sellers ahead of buyers at the opening. This formed a quotation gap.
Opening Gap DOWN
Type : Bearish
Timeframe : Openning
A study of price movements over other periods shows the following variations:
Near a new LOW record (1st january)
Type : Bearish
Timeframe : Weekly
Technical
Technical analysis of DENALI THERAPEUTICS INC. in Daily shows a overall strongly bearish trend. 89.29% of the signals given by moving averages are bearish. The overall trend is supported by the strong bearish signals from short-term moving averages. The Central Indicators scanner detects bearish signals on moving averages that could impact this trend:
Bearish price crossover with Moving Average 50
Type : Bearish
Timeframe : Daily
Bearish price crossover with adaptative moving average 20
Type : Bearish
Timeframe : Daily
In fact, according to the parameters integrated into the Central Analyzer system, 12 technical indicators out of 18 analysed are currently bearish. But beware of excesses. The Central Indicators scanner currently detects this:
CCI indicator is oversold : under -100
Type : Neutral
Timeframe : Daily
Williams %R indicator is oversold : under -80
Type : Neutral
Timeframe : Daily
MACD crosses DOWN its Moving Average
Type : Bearish
Timeframe : Daily
Parabolic SAR indicator bearish reversal
Type : Bearish
Timeframe : Daily
Ichimoku : price is under the cloud
Type : Bearish
Timeframe : Daily
SuperTrend indicator bearish reversal
Type : Bearish
Timeframe : Daily
Price is back under the pivot point
Type : Bearish
Timeframe : Daily
Price is back under the pivot point
Type : Bearish
Timeframe : Weekly
Momentum indicator is back under 0
Type : Bearish
Timeframe : Daily
Central Patterns, the market scanner focusing on chart patterns, resistances and supports found these results:
Near horizontal support
Type : Bullish
Timeframe : Daily
Near support of channel
Type : Bullish
Timeframe : Daily
No result was found by the Central Candlesticks scanner on Japanese candlesticks.
| S3 | S2 | S1 | Price | R1 | R2 | R3 | |
|---|---|---|---|---|---|---|---|
| ProTrendLines | 13.88 | 16.67 | 18.43 | 18.75 | 21.82 | 24.66 | 28.14 |
| Change (%) | -25.97% | -11.09% | -1.71% | - | +16.37% | +31.52% | +50.08% |
| Change | -4.87 | -2.08 | -0.32 | - | +3.07 | +5.91 | +9.39 |
| Level | Minor | Minor | Major | - | Major | Minor | Minor |
Pivot points can also be used to set your price objectives. Here is the price situation in relation to pivot points:
| Pivot points | S3 | S2 | S1 | PP | R1 | R2 | R3 |
|---|---|---|---|---|---|---|---|
| Standard | 17.17 | 18.07 | 18.55 | 19.44 | 19.92 | 20.81 | 21.29 |
| Camarilla | 18.64 | 18.77 | 18.89 | 19.02 | 19.15 | 19.27 | 19.40 |
| Woodie | 16.96 | 17.96 | 18.34 | 19.34 | 19.71 | 20.71 | 21.08 |
| Fibonacci | 18.07 | 18.59 | 18.92 | 19.44 | 19.96 | 20.29 | 20.81 |
| Pivot points | S3 | S2 | S1 | PP | R1 | R2 | R3 |
|---|---|---|---|---|---|---|---|
| Standard | 14.61 | 16.79 | 17.90 | 20.08 | 21.20 | 23.38 | 24.49 |
| Camarilla | 18.11 | 18.42 | 18.72 | 19.02 | 19.32 | 19.62 | 19.93 |
| Woodie | 14.08 | 16.52 | 17.37 | 19.82 | 20.67 | 23.11 | 23.96 |
| Fibonacci | 16.79 | 18.05 | 18.82 | 20.08 | 21.34 | 22.12 | 23.38 |
| Pivot points | S3 | S2 | S1 | PP | R1 | R2 | R3 |
|---|---|---|---|---|---|---|---|
| Standard | 16.92 | 18.17 | 19.76 | 21.01 | 22.60 | 23.85 | 25.44 |
| Camarilla | 20.57 | 20.83 | 21.09 | 21.35 | 21.61 | 21.87 | 22.13 |
| Woodie | 17.09 | 18.26 | 19.93 | 21.10 | 22.77 | 23.94 | 25.61 |
| Fibonacci | 18.17 | 19.26 | 19.93 | 21.01 | 22.10 | 22.77 | 23.85 |
Numerical data
The following are the details of the technical indicators and moving averages that were collected to generate this technical analysis:
| RSI (14): | 37.73 | |
| MACD (12,26,9): | -0.1200 | |
| Directional Movement: | -10.88 | |
| AROON (14): | -21.43 | |
| DEMA (21): | 20.29 | |
| Parabolic SAR (0,02-0,02-0,2): | 22.19 | |
| Elder Ray (13): | -1.77 | |
| Super Trend (3,10): | 21.47 | |
| Zig ZAG (10): | 18.75 | |
| VORTEX (21): | 0.8700 | |
| Stochastique (14,3,5): | 15.35 | |
| TEMA (21): | 20.23 | |
| Williams %R (14): | -86.24 | |
| Chande Momentum Oscillator (20): | -2.05 | |
| Repulse (5,40,3): | -7.6200 | |
| ROCnROLL: | 2 | |
| TRIX (15,9): | 0.0800 | |
| Courbe Coppock: | 1.08 |
| MA7: | 20.52 | |
| MA20: | 20.47 | |
| MA50: | 20.06 | |
| MA100: | 21.90 | |
| MAexp7: | 20.02 | |
| MAexp20: | 20.37 | |
| MAexp50: | 20.61 | |
| MAexp100: | 20.88 | |
| Price / MA7: | -8.63% | |
| Price / MA20: | -8.40% | |
| Price / MA50: | -6.53% | |
| Price / MA100: | -14.38% | |
| Price / MAexp7: | -6.34% | |
| Price / MAexp20: | -7.95% | |
| Price / MAexp50: | -9.02% | |
| Price / MAexp100: | -10.20% |
News
The last news published on DENALI THERAPEUTICS INC. at the time of the generation of this analysis was as follows:
- 08/05/2019 - 13:00 Denali Therapeutics Announces That Its Partner Sanofi has Commenced Dosing of DNL758 in a Phase 1 Study
- 06/11/2019 - 13:00 Denali Therapeutics Receives Orphan Drug and Rare Pediatric Disease Designation for DNL310, and Expands its Portfolio of Brain Penetrant Enzyme Replacement Programs
- 05/08/2019 - 20:30 Denali Therapeutics Reports First Quarter 2019 Financial Results
- 03/12/2019 - 13:00 Denali Therapeutics Reports Full Year 2018 Financial Results and Business Highlights
- 02/15/2019 - 14:00 Denali Therapeutics Announces First Patient Dosed in Phase 1b Study of DNL747 for Alzheimer’s Disease
About author

Online


Add a comment
Comments
0 comments on the analysis DENALI THERAPEUTICS INC. - Daily