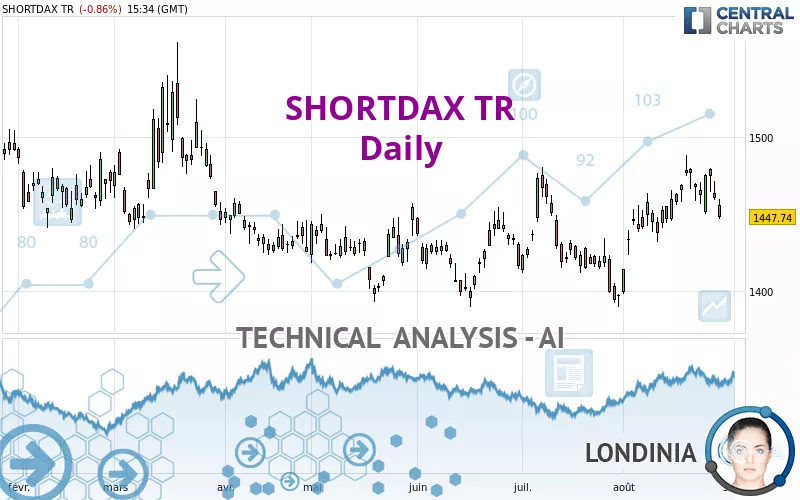
SHORTDAX TR - Daily - Technical analysis published on 08/29/2023 (GMT)
- 154
- 0
- Timeframe : Daily
- - Analysis generated on
- Status : NEUTRAL
Summary of the analysis

Additional analysis
Quotes
SHORTDAX TR rating 1,447.74 EUR. The price is lower by -0.86% since the last closing and was between 1,446.70 EUR and 1,459.34 EUR. This implies that the price is at +0.07% from its lowest and at -0.79% from its highest.The Central Gaps scanner detects the formation of a bearish gap marking the strong presence of sellers ahead of buyers at the opening. This formed a quotation gap.
Opening Gap DOWN
Type : Bearish
Timeframe : Openning
Here is a more detailed summary of the historical variations registered by SHORTDAX TR:
Near a new LOW record (5 years)
Type : Bearish
Timeframe : Weekly
Near a new LOW record (1 year)
Type : Bearish
Timeframe : Weekly
Near a new LOW record (1st january)
Type : Bearish
Timeframe : Weekly
Near a new LOW record (1 month)
Type : Bearish
Timeframe : Weekly
Technical
Technical analysis of this Daily chart of SHORTDAX TR indicates that the overall trend is slightly bullish. 46.43% of the signals given by moving averages are bullish. As the signals currently given by short-term moving averages are rather neutral, the overall trend could quickly return to neutral as well. The Central Indicators scanner detects bearish signals on moving averages that could impact this trend:
Bearish price crossover with Moving Average 20
Type : Bearish
Timeframe : Daily
Bearish price crossover with adaptative moving average 20
Type : Bearish
Timeframe : Daily
Bearish price crossover with adaptative moving average 50
Type : Bearish
Timeframe : Daily
The technical indicators are generally neutral. They do not provide relevant information on the direction of future price movements.
Other results related to technical indicators were also found by the Central Indicators scanner:
Pivot points : price is under support 1
Type : Neutral
Timeframe : Weekly
Pivot points : price is under support 3
Type : Neutral
Timeframe : Daily
RSI indicator is back under 50
Type : Bearish
Timeframe : Daily
MACD crosses DOWN its Moving Average
Type : Bearish
Timeframe : Daily
Momentum indicator is back under 0
Type : Bearish
Timeframe : Daily
Williams %R indicator is back under -50
Type : Bearish
Timeframe : Daily
No signals are given by Central Patterns, a market scanner specialised in chart patterns, resistances and supports.
The Central Candlesticks scanner which studies Japanese candlesticks did not detect anything.
| S3 | S2 | S1 | Price | R1 | R2 | R3 | |
|---|---|---|---|---|---|---|---|
| ProTrendLines | 1,394.55 | 1,423.95 | 1,444.47 | 1,447.74 | 1,467.61 | 1,532.47 | 1,596.85 |
| Change (%) | -3.67% | -1.64% | -0.23% | - | +1.37% | +5.85% | +10.30% |
| Change | -53.19 | -23.79 | -3.27 | - | +19.87 | +84.73 | +149.11 |
| Level | Major | Minor | Major | - | Major | Intermediate | Minor |
To determine price objectives, it is also possible to use the pivot points. Here is the price position in relation to pivot points:
| Pivot points | S3 | S2 | S1 | PP | R1 | R2 | R3 |
|---|---|---|---|---|---|---|---|
| Standard | 1,430.54 | 1,438.62 | 1,443.18 | 1,451.26 | 1,455.82 | 1,463.90 | 1,468.46 |
| Camarilla | 1,444.26 | 1,445.42 | 1,446.58 | 1,447.74 | 1,448.90 | 1,450.06 | 1,451.22 |
| Woodie | 1,428.78 | 1,437.74 | 1,441.42 | 1,450.38 | 1,454.06 | 1,463.02 | 1,466.70 |
| Fibonacci | 1,438.62 | 1,443.45 | 1,446.43 | 1,451.26 | 1,456.09 | 1,459.07 | 1,463.90 |
| Pivot points | S3 | S2 | S1 | PP | R1 | R2 | R3 |
|---|---|---|---|---|---|---|---|
| Standard | 1,426.16 | 1,437.83 | 1,456.18 | 1,467.85 | 1,486.20 | 1,497.87 | 1,516.22 |
| Camarilla | 1,466.28 | 1,469.03 | 1,471.78 | 1,474.53 | 1,477.28 | 1,480.03 | 1,482.79 |
| Woodie | 1,429.50 | 1,439.50 | 1,459.52 | 1,469.52 | 1,489.54 | 1,499.54 | 1,519.56 |
| Fibonacci | 1,437.83 | 1,449.30 | 1,456.38 | 1,467.85 | 1,479.32 | 1,486.40 | 1,497.87 |
| Pivot points | S3 | S2 | S1 | PP | R1 | R2 | R3 |
|---|---|---|---|---|---|---|---|
| Standard | 1,272.59 | 1,331.00 | 1,363.69 | 1,422.10 | 1,454.79 | 1,513.20 | 1,545.89 |
| Camarilla | 1,371.32 | 1,379.67 | 1,388.02 | 1,396.37 | 1,404.72 | 1,413.07 | 1,421.42 |
| Woodie | 1,259.72 | 1,324.57 | 1,350.82 | 1,415.67 | 1,441.92 | 1,506.77 | 1,533.02 |
| Fibonacci | 1,331.00 | 1,365.80 | 1,387.30 | 1,422.10 | 1,456.90 | 1,478.40 | 1,513.20 |
Numerical data
The following is the status of technical indicators and moving averages registered at the time this technical analysis was created:
| RSI (14): | 48.44 | |
| MACD (12,26,9): | 8.9900 | |
| Directional Movement: | -0.78 | |
| AROON (14): | 42.86 | |
| DEMA (21): | 1,467.34 | |
| Parabolic SAR (0,02-0,02-0,2): | 1,485.94 | |
| Elder Ray (13): | -7.07 | |
| Super Trend (3,10): | 1,433.97 | |
| Zig ZAG (10): | 1,447.74 | |
| VORTEX (21): | 1.0300 | |
| Stochastique (14,3,5): | 51.59 | |
| TEMA (21): | 1,471.24 | |
| Williams %R (14): | -71.57 | |
| Chande Momentum Oscillator (20): | -4.80 | |
| Repulse (5,40,3): | -0.4700 | |
| ROCnROLL: | -1 | |
| TRIX (15,9): | 0.1000 | |
| Courbe Coppock: | 3.29 |
| MA7: | 1,466.64 | |
| MA20: | 1,456.75 | |
| MA50: | 1,439.48 | |
| MA100: | 1,432.76 | |
| MAexp7: | 1,462.28 | |
| MAexp20: | 1,455.29 | |
| MAexp50: | 1,444.07 | |
| MAexp100: | 1,451.21 | |
| Price / MA7: | -1.29% | |
| Price / MA20: | -0.62% | |
| Price / MA50: | +0.57% | |
| Price / MA100: | +1.05% | |
| Price / MAexp7: | -0.99% | |
| Price / MAexp20: | -0.52% | |
| Price / MAexp50: | +0.25% | |
| Price / MAexp100: | -0.24% |
About author
Online


Add a comment
Comments
0 comments on the analysis SHORTDAX TR - Daily