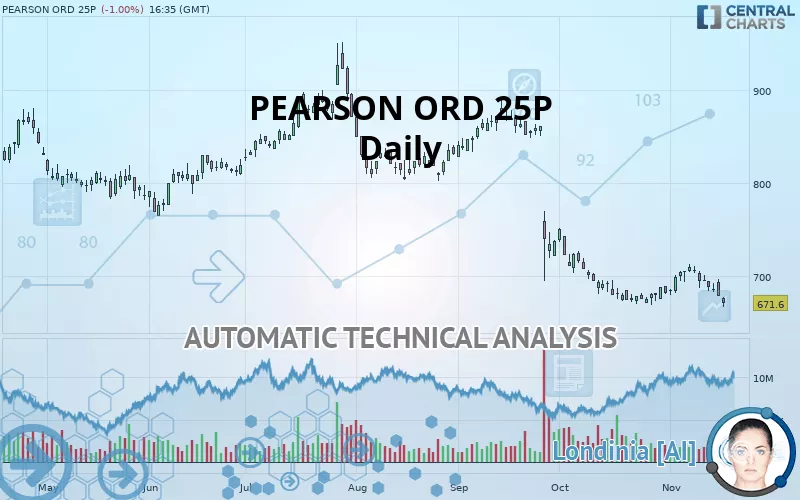
PEARSON ORD 25P - Daily - Technical analysis published on 11/18/2019 (GMT)
- 373
- 0
- Who voted?
Click here for a new analysis!
- Timeframe : Daily
- - Analysis generated on
- Status : LEVEL MAINTAINED
Summary of the analysis

Additional analysis
Quotes
The PEARSON ORD 25P price is 671.6 GBX. The price is lower by -1.00% since the last closing and was between 666.8 GBX and 677.0 GBX. This implies that the price is at +0.72% from its lowest and at -0.80% from its highest.The Central Gaps scanner detects a bearish gap which is a sign that the sellers have taken the lead in the very short term.
Opening Gap DOWN
Type : Bearish
Timeframe : Openning
So that you have an overall view of the price change, here is a table showing the variations over several periods:
New LOW record (1 year)
Type : Bearish
Timeframe : Weekly
New LOW record (1st january)
Type : Bearish
Timeframe : Weekly
New LOW record (1 month)
Type : Bearish
Timeframe : Weekly
Technical
Technical analysis of this Daily chart of PEARSON ORD 25P indicates that the overall trend is strongly bearish. The signals given by moving averages are 92.86% bearish. This strong bearish trend is confirmed by the strong signals currently being given by short-term moving averages. The Central Indicators scanner detects a bearish signal on moving averages that could impact this trend:
Bearish price crossover with adaptative moving average 20
Type : Bearish
Timeframe : Daily
An assessment of technical indicators shows a bearish signal.
Caution: the Central Indicators scanner currently detects an excess:
Williams %R indicator is oversold : under -80
Type : Neutral
Timeframe : Daily
Pivot points : price is under support 1
Type : Neutral
Timeframe : Daily
Price is back under the pivot point
Type : Bearish
Timeframe : Weekly
Momentum indicator is back under 0
Type : Bearish
Timeframe : Daily
Central Patterns, the market scanner focusing on chart patterns, resistances and supports found this result:
Near horizontal support
Type : Bullish
Timeframe : Daily
The presence of a bearish pattern in Japanese candlesticks detected by Central Candlesticks that could cause a correction in the very short term was also detected:
Bearish engulfing lines
Type : Bearish
Timeframe : Daily
| S2 | S1 | Price | R1 | R2 | R3 | |
|---|---|---|---|---|---|---|
| ProTrendLines | 567.8 | 616.0 | 671.6 | 682.0 | 725.8 | 777.4 |
| Change (%) | -15.46% | -8.28% | - | +1.55% | +8.07% | +15.75% |
| Change | -103.8 | -55.6 | - | +10.4 | +54.2 | +105.8 |
| Level | Major | Minor | - | Major | Intermediate | Minor |
Attention could also be paid to pivot points to set price objectives:
| Pivot points | S3 | S2 | S1 | PP | R1 | R2 | R3 |
|---|---|---|---|---|---|---|---|
| Standard | 654.1 | 666.3 | 672.3 | 684.5 | 690.5 | 702.7 | 708.7 |
| Camarilla | 673.4 | 675.1 | 676.7 | 678.4 | 680.1 | 681.7 | 683.4 |
| Woodie | 651.1 | 664.8 | 669.3 | 683.0 | 687.5 | 701.2 | 705.7 |
| Fibonacci | 666.3 | 673.2 | 677.5 | 684.5 | 691.4 | 695.7 | 702.7 |
| Pivot points | S3 | S2 | S1 | PP | R1 | R2 | R3 |
|---|---|---|---|---|---|---|---|
| Standard | 642.7 | 660.5 | 669.5 | 687.3 | 696.3 | 714.1 | 723.1 |
| Camarilla | 671.0 | 673.5 | 675.9 | 678.4 | 680.9 | 683.3 | 685.8 |
| Woodie | 638.2 | 658.3 | 665.0 | 685.1 | 691.8 | 711.9 | 718.6 |
| Fibonacci | 660.5 | 670.8 | 677.1 | 687.3 | 697.6 | 703.9 | 714.1 |
| Pivot points | S3 | S2 | S1 | PP | R1 | R2 | R3 |
|---|---|---|---|---|---|---|---|
| Standard | 567.8 | 618.6 | 650.4 | 701.2 | 733.0 | 783.8 | 815.6 |
| Camarilla | 659.5 | 667.1 | 674.6 | 682.2 | 689.8 | 697.3 | 704.9 |
| Woodie | 558.3 | 613.9 | 640.9 | 696.5 | 723.5 | 779.1 | 806.1 |
| Fibonacci | 618.6 | 650.2 | 669.7 | 701.2 | 732.8 | 752.3 | 783.8 |
Numerical data
The following is the status of the technical indicators and moving averages at the time of publication of this technical analysis:
| RSI (14): | 31.10 | |
| MACD (12,26,9): | -10.8000 | |
| Directional Movement: | -21.6 | |
| AROON (14): | -50.0 | |
| DEMA (21): | 676.3 | |
| Parabolic SAR (0,02-0,02-0,2): | 708.9 | |
| Elder Ray (13): | -16.5 | |
| Super Trend (3,10): | 708.3 | |
| Zig ZAG (10): | 671.6 | |
| VORTEX (21): | 1.0000 | |
| Stochastique (14,3,5): | 21.30 | |
| TEMA (21): | 686.1 | |
| Williams %R (14): | -89.50 | |
| Chande Momentum Oscillator (20): | -10.6 | |
| Repulse (5,40,3): | -3.3000 | |
| ROCnROLL: | 2 | |
| TRIX (15,9): | -0.3000 | |
| Courbe Coppock: | 2.50 |
| MA7: | 688.7 | |
| MA20: | 687.9 | |
| MA50: | 736.9 | |
| MA100: | 789.8 | |
| MAexp7: | 685.1 | |
| MAexp20: | 693.3 | |
| MAexp50: | 726.0 | |
| MAexp100: | 763.1 | |
| Price / MA7: | -2.48% | |
| Price / MA20: | -2.37% | |
| Price / MA50: | -8.86% | |
| Price / MA100: | -14.97% | |
| Price / MAexp7: | -1.97% | |
| Price / MAexp20: | -3.13% | |
| Price / MAexp50: | -7.49% | |
| Price / MAexp100: | -11.99% |
News
The last news published on PEARSON ORD 25P at the time of the generation of this analysis was as follows:
- Vonage CFO Dave Pearson Named 2019 NJBIZ CFO Of The Year
- Pearson VUE study reveals the ever-advancing global IT industry requires the backbone of certification
- ManpowerGroup to Offer General Education Diploma (GED) Program in Partnership with Pearson Putting Career Progression within Reach for Thousands of their Associates Across the U.S.
- Bhang Chief Operating Officer, Jamie Pearson, to Keynote Los Angeles CannaGather
- Bhang Corporation’s Scott Van Rixel and Jamie Pearson Named to High Times' Most Influential People in Cannabis
About author

Online


Add a comment
Comments
0 comments on the analysis PEARSON ORD 25P - Daily