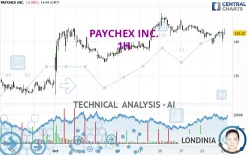
PAYCHEX INC. - 1H - Technical analysis published on 10/23/2024 (GMT)
- 120
- 0
- Timeframe : 1H
- - Analysis generated on
- Status : NEUTRAL

Summary of the analysis

Additional analysis
Quotes
The PAYCHEX INC. rating is 141.22 USD. On the day, this instrument lost -0.09% and was between 140.01 USD and 141.91 USD. This implies that the price is at +0.86% from its lowest and at -0.49% from its highest.A bearish opening was detected by the Central Gaps scanner. Sellers are trying to impose a bearish trend in the very short term.
Bearish opening
Type : Bearish
Timeframe : Openning
A study of price movements over other periods shows the following variations:
Near a new HIGH record (5 years)
Type : Bullish
Timeframe : Weekly
Near a new HIGH record (1 year)
Type : Bullish
Timeframe : Weekly
Near a new HIGH record (1st january)
Type : Bullish
Timeframe : Weekly
Near a new HIGH record (1 month)
Type : Bullish
Timeframe : Weekly
Technical
Technical analysis of PAYCHEX INC. in 1H shows an overall slightly bullish trend. 60.71% of the signals given by moving averages are bullish. As the signals currently given by short-term moving averages are rather neutral, the slightly bullish trend could return to neutral. The Central Indicators scanner detects bearish signals on moving averages that could impact this trend:
Bearish price crossover with Moving Average 20
Type : Bearish
Timeframe : 1 hour
Bearish price crossover with adaptative moving average 50
Type : Bearish
Timeframe : 1 hour
Technical indicators are slightly bullish. There is therefore considerable uncertainty about the continuation of the increase.
Central Indicators, the detector scanner for these technical indicators has recently detected several signals:
RSI indicator is back under 50
Type : Bearish
Timeframe : 1 hour
Aroon indicator bullish trend
Type : Bullish
Timeframe : 1 hour
Ichimoku : price is over the cloud
Type : Bullish
Timeframe : 1 hour
Price is back under the pivot point
Type : Bearish
Timeframe : Weekly
Momentum indicator is back under 0
Type : Bearish
Timeframe : 1 hour
Central Patterns, the market scanner focusing on chart patterns, resistances and supports found this result:
Near resistance of channel
Type : Bearish
Timeframe : 1 hour
Central Candlesticks, the scanner specialised in Japanese candlesticks, detects a bearish signal that could support the hypothesis of a small drop in the very short term:
Bearish harami
Type : Bearish
Timeframe : 1 hour
| S3 | S2 | S1 | Price | R1 | R2 | |
|---|---|---|---|---|---|---|
| ProTrendLines | 134.89 | 136.98 | 140.82 | 141.22 | 142.35 | 144.17 |
| Change (%) | -4.48% | -3.00% | -0.28% | - | +0.80% | +2.09% |
| Change | -6.33 | -4.24 | -0.40 | - | +1.13 | +2.95 |
| Level | Minor | Minor | Minor | - | Major | Intermediate |
Attention could also be paid to pivot points to set price objectives:
| Pivot points | S3 | S2 | S1 | PP | R1 | R2 | R3 |
|---|---|---|---|---|---|---|---|
| Standard | 137.96 | 138.75 | 140.05 | 140.84 | 142.14 | 142.93 | 144.23 |
| Camarilla | 140.77 | 140.96 | 141.15 | 141.34 | 141.53 | 141.72 | 141.92 |
| Woodie | 138.21 | 138.88 | 140.30 | 140.97 | 142.39 | 143.06 | 144.48 |
| Fibonacci | 138.75 | 139.55 | 140.05 | 140.84 | 141.64 | 142.14 | 142.93 |
| Pivot points | S3 | S2 | S1 | PP | R1 | R2 | R3 |
|---|---|---|---|---|---|---|---|
| Standard | 133.09 | 135.84 | 138.68 | 141.43 | 144.27 | 147.02 | 149.86 |
| Camarilla | 139.99 | 140.51 | 141.02 | 141.53 | 142.04 | 142.56 | 143.07 |
| Woodie | 133.15 | 135.86 | 138.74 | 141.45 | 144.33 | 147.04 | 149.92 |
| Fibonacci | 135.84 | 137.97 | 139.29 | 141.43 | 143.56 | 144.88 | 147.02 |
| Pivot points | S3 | S2 | S1 | PP | R1 | R2 | R3 |
|---|---|---|---|---|---|---|---|
| Standard | 121.13 | 125.02 | 129.61 | 133.50 | 138.09 | 141.98 | 146.57 |
| Camarilla | 131.86 | 132.64 | 133.41 | 134.19 | 134.97 | 135.75 | 136.52 |
| Woodie | 121.47 | 125.20 | 129.95 | 133.68 | 138.43 | 142.16 | 146.91 |
| Fibonacci | 125.02 | 128.26 | 130.26 | 133.50 | 136.74 | 138.74 | 141.98 |
Numerical data
The following is the status of the technical indicators and moving averages at the time of publication of this technical analysis:
| RSI (14): | 46.61 | |
| MACD (12,26,9): | -0.1200 | |
| Directional Movement: | -11.41 | |
| AROON (14): | 57.14 | |
| DEMA (21): | 141.07 | |
| Parabolic SAR (0,02-0,02-0,2): | 139.87 | |
| Elder Ray (13): | 0.28 | |
| Super Trend (3,10): | 142.04 | |
| Zig ZAG (10): | 141.03 | |
| VORTEX (21): | 0.9200 | |
| Stochastique (14,3,5): | 72.97 | |
| TEMA (21): | 140.92 | |
| Williams %R (14): | -34.53 | |
| Chande Momentum Oscillator (20): | -0.28 | |
| Repulse (5,40,3): | 0.2700 | |
| ROCnROLL: | -1 | |
| TRIX (15,9): | -0.0200 | |
| Courbe Coppock: | 0.45 |
| MA7: | 141.69 | |
| MA20: | 139.38 | |
| MA50: | 134.23 | |
| MA100: | 127.97 | |
| MAexp7: | 141.14 | |
| MAexp20: | 141.23 | |
| MAexp50: | 141.12 | |
| MAexp100: | 140.11 | |
| Price / MA7: | -0.33% | |
| Price / MA20: | +1.32% | |
| Price / MA50: | +5.21% | |
| Price / MA100: | +10.35% | |
| Price / MAexp7: | +0.06% | |
| Price / MAexp20: | -0.01% | |
| Price / MAexp50: | +0.07% | |
| Price / MAexp100: | +0.79% |
News
Don't forget to follow the news on PAYCHEX INC.. At the time of publication of this analysis, the latest news was as follows:
- Small Business Jobs and Wages Increase Modestly in March
- Paychex Named Among FORTUNE's Most Innovative Companies
- Paychex, Inc. Reports Third Quarter Results: Strong Revenue and Earnings Growth
- Paychex Charitable Foundation to Donate $1 Million to Mental Health America
- Paychex, Inc. Schedules Third Quarter Fiscal 2023 Earnings Conference Call for March 29, 2023
About author
Online


Add a comment
Comments
0 comments on the analysis PAYCHEX INC. - 1H