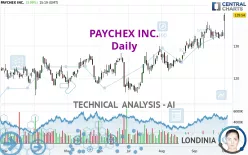
PAYCHEX INC. - Daily - Technical analysis published on 10/01/2024 (GMT)
- 119
- 0
Click here for a new analysis!
- Timeframe : Daily
- - Analysis generated on
- Status : TARGET REACHED

Summary of the analysis

Additional analysis
Quotes
PAYCHEX INC. rating 139.49 USD. The price registered an increase of +3.95% on the session and was traded between 132.18 USD and 140.11 USD over the period. The price is currently at +5.53% from its lowest and -0.44% from its highest.The Central Gaps scanner detects the formation of a bullish gap marking the strong presence of buyers against sellers at the opening. This formed a quotation gap.
Opening Gap UP
Type : Bullish
Timeframe : Openning
So that you have an overall view of the price change, here is a table showing the variations over several periods:
New HIGH record (5 years)
Type : Bullish
Timeframe : Weekly
New HIGH record (1 year)
Type : Bullish
Timeframe : Weekly
New HIGH record (1st january)
Type : Bullish
Timeframe : Weekly
New HIGH record (1 month)
Type : Bullish
Timeframe : Weekly
Technical
A technical analysis in Daily of this PAYCHEX INC. chart shows a strongly bullish trend. 92.86% of the signals given by moving averages are bullish. The overall trend is supported by the strong bullish signals from short-term moving averages. The Central Indicators market scanner currently does not detect any result that concerns moving averages.
In fact, according to the parameters integrated into the Central Analyzer system, 14 technical indicators out of 18 analysed are currently bullish. Caution: the Central Indicators scanner currently detects an excess:
RSI indicator is overbought : over 70
Type : Neutral
Timeframe : Daily
CCI indicator is overbought : over 100
Type : Neutral
Timeframe : Daily
Williams %R indicator is overbought : over -20
Type : Neutral
Timeframe : Daily
Pivot points : price is over resistance 3
Type : Neutral
Timeframe : Daily
Pivot points : price is over resistance 3
Type : Neutral
Timeframe : Weekly
MACD crosses UP its Moving Average
Type : Bullish
Timeframe : Daily
Parabolic SAR indicator bullish reversal
Type : Bullish
Timeframe : Daily
The Central Patterns scanner, which studies chart patterns, resistances and supports, has identified these signals:
Near support of channel
Type : Bullish
Timeframe : Daily
Horizontal support is broken
Type : Bearish
Timeframe : Daily
For a small rebound in the very short term, the Central Candlesticks scanner currently notes the presence of this bullish pattern in Japanese candlesticks:
Long white line
Type : Bullish
Timeframe : Daily
| S3 | S2 | S1 | Price | |
|---|---|---|---|---|
| ProTrendLines | 129.40 | 131.24 | 134.06 | 139.49 |
| Change (%) | -7.23% | -5.91% | -3.89% | - |
| Change | -10.09 | -8.25 | -5.43 | - |
| Level | Intermediate | Major | Major | - |
To determine price objectives, it is also possible to use the pivot points. Here is the price position in relation to pivot points:
| Pivot points | S3 | S2 | S1 | PP | R1 | R2 | R3 |
|---|---|---|---|---|---|---|---|
| Standard | 131.23 | 132.08 | 133.13 | 133.98 | 135.03 | 135.88 | 136.93 |
| Camarilla | 133.67 | 133.84 | 134.02 | 134.19 | 134.36 | 134.54 | 134.71 |
| Woodie | 131.34 | 132.13 | 133.24 | 134.03 | 135.14 | 135.93 | 137.04 |
| Fibonacci | 132.08 | 132.80 | 133.25 | 133.98 | 134.70 | 135.15 | 135.88 |
| Pivot points | S3 | S2 | S1 | PP | R1 | R2 | R3 |
|---|---|---|---|---|---|---|---|
| Standard | 129.00 | 130.57 | 131.78 | 133.35 | 134.56 | 136.13 | 137.34 |
| Camarilla | 132.23 | 132.48 | 132.74 | 132.99 | 133.25 | 133.50 | 133.76 |
| Woodie | 128.82 | 130.48 | 131.60 | 133.26 | 134.38 | 136.04 | 137.16 |
| Fibonacci | 130.57 | 131.63 | 132.29 | 133.35 | 134.41 | 135.07 | 136.13 |
| Pivot points | S3 | S2 | S1 | PP | R1 | R2 | R3 |
|---|---|---|---|---|---|---|---|
| Standard | 121.13 | 125.02 | 129.61 | 133.50 | 138.09 | 141.98 | 146.57 |
| Camarilla | 131.86 | 132.64 | 133.41 | 134.19 | 134.97 | 135.75 | 136.52 |
| Woodie | 121.47 | 125.20 | 129.95 | 133.68 | 138.43 | 142.16 | 146.91 |
| Fibonacci | 125.02 | 128.26 | 130.26 | 133.50 | 136.74 | 138.74 | 141.98 |
Numerical data
The following is the status of the technical indicators and moving averages at the time of publication of this technical analysis:
| RSI (14): | 72.53 | |
| MACD (12,26,9): | 1.7400 | |
| Directional Movement: | 19.79 | |
| AROON (14): | 100.00 | |
| DEMA (21): | 135.51 | |
| Parabolic SAR (0,02-0,02-0,2): | 132.14 | |
| Elder Ray (13): | 2.16 | |
| Super Trend (3,10): | 128.66 | |
| Zig ZAG (10): | 139.00 | |
| VORTEX (21): | 1.0400 | |
| Stochastique (14,3,5): | 64.52 | |
| TEMA (21): | 135.47 | |
| Williams %R (14): | -14.28 | |
| Chande Momentum Oscillator (20): | 3.84 | |
| Repulse (5,40,3): | 3.0400 | |
| ROCnROLL: | 1 | |
| TRIX (15,9): | 0.2000 | |
| Courbe Coppock: | 2.56 |
| MA7: | 134.14 | |
| MA20: | 133.42 | |
| MA50: | 129.10 | |
| MA100: | 125.06 | |
| MAexp7: | 134.74 | |
| MAexp20: | 133.14 | |
| MAexp50: | 129.76 | |
| MAexp100: | 126.41 | |
| Price / MA7: | +3.99% | |
| Price / MA20: | +4.55% | |
| Price / MA50: | +8.05% | |
| Price / MA100: | +11.54% | |
| Price / MAexp7: | +3.53% | |
| Price / MAexp20: | +4.77% | |
| Price / MAexp50: | +7.50% | |
| Price / MAexp100: | +10.35% |
News
The last news published on PAYCHEX INC. at the time of the generation of this analysis was as follows:
- Small Business Jobs and Wages Increase Modestly in March
- Paychex Named Among FORTUNE's Most Innovative Companies
- Paychex, Inc. Reports Third Quarter Results: Strong Revenue and Earnings Growth
- Paychex Charitable Foundation to Donate $1 Million to Mental Health America
- Paychex, Inc. Schedules Third Quarter Fiscal 2023 Earnings Conference Call for March 29, 2023
About author
Online


Add a comment
Comments
0 comments on the analysis PAYCHEX INC. - Daily